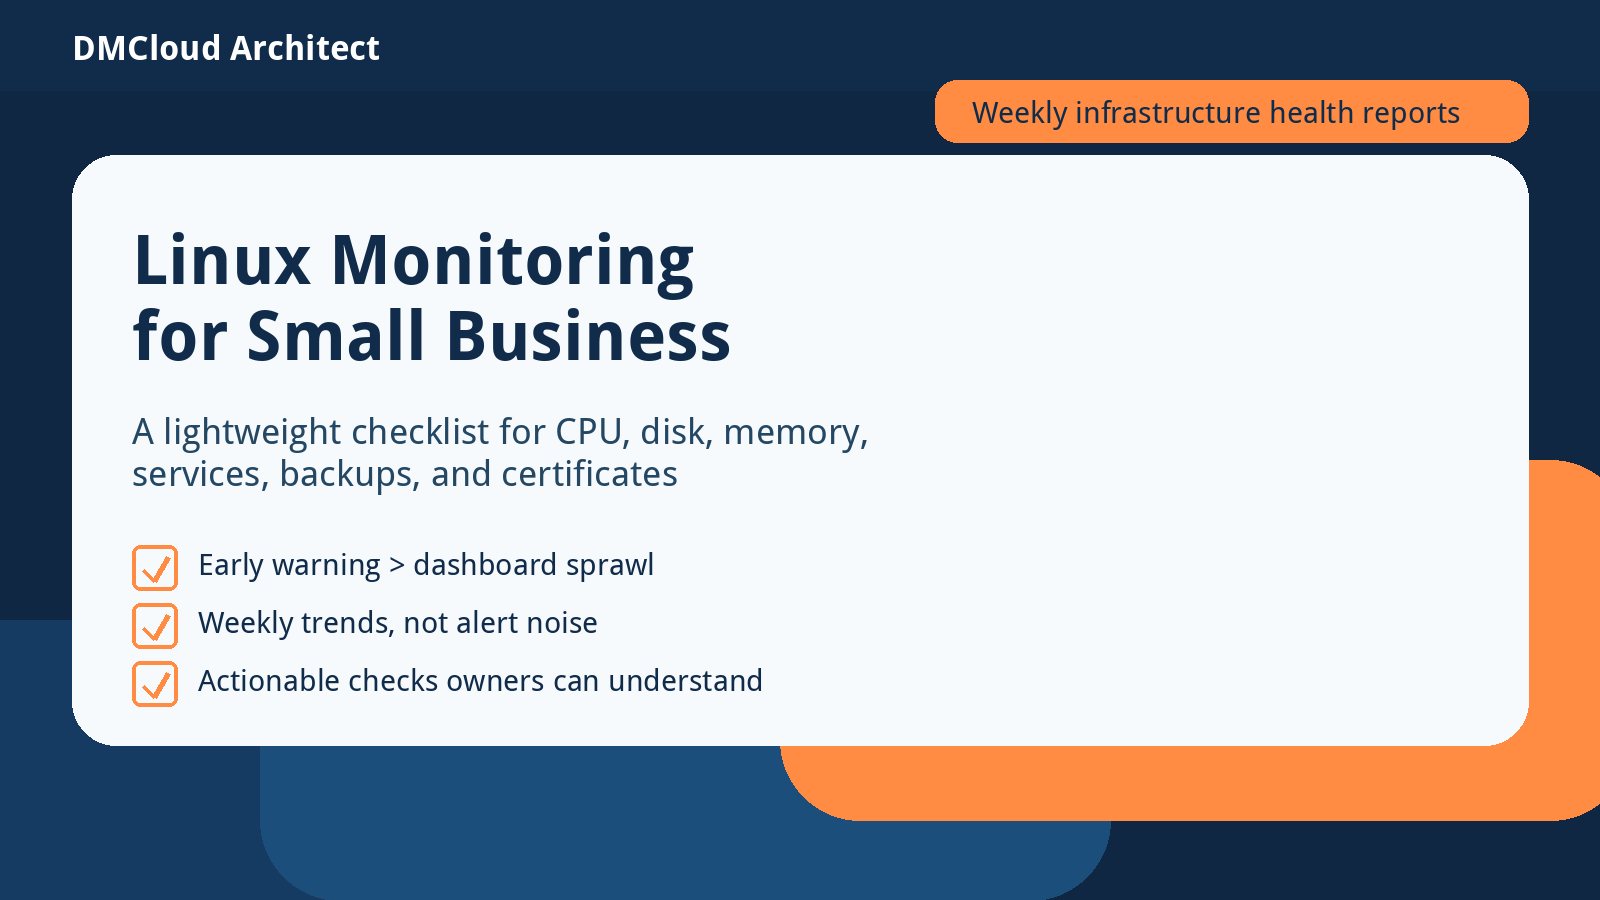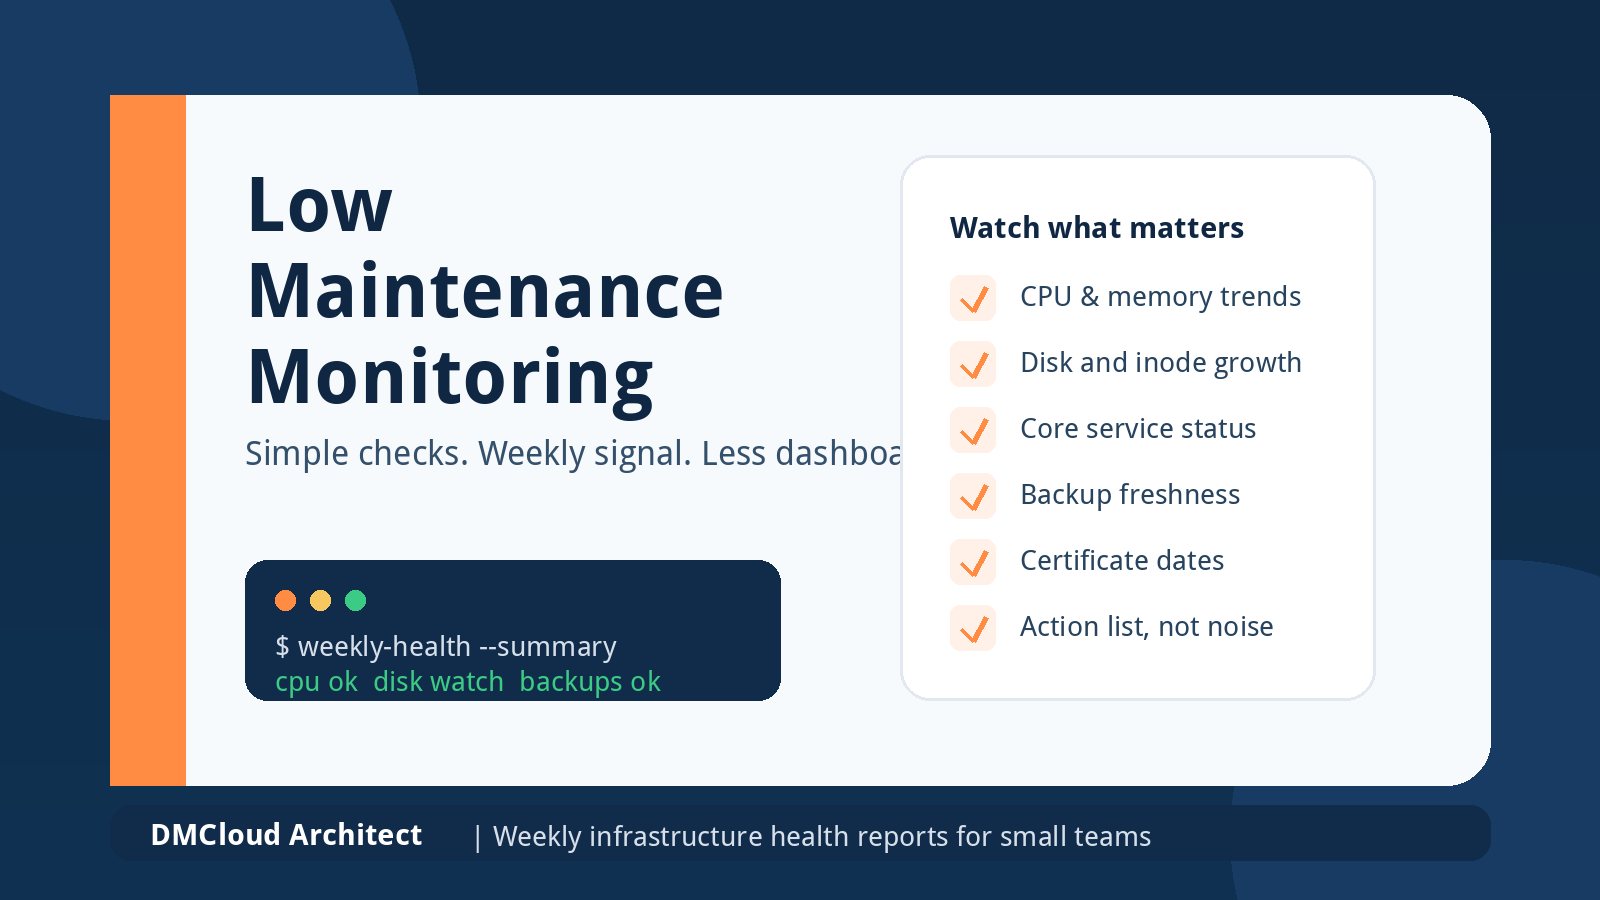
Low maintenance monitoring is for teams that need early warnings, not another system that demands attention every morning. Developers, founders, and small business owners often know they should watch their servers, but the setup can feel bigger than the risk they are trying to manage.
The better starting point is a simple monitoring system that answers one practical question: is anything changing in a way that could hurt customers, sales, backups, or support tomorrow? When monitoring stays small and action-focused, it becomes a weekly operations habit instead of dashboard sprawl.
Start with the signals that create decisions
A useful monitoring plan begins with the failure modes you would actually respond to. For most small infrastructure environments, that means full disks, rising CPU load, memory pressure, stopped services, missed backups, expiring certificates, unusual login activity, and database growth that is quietly eating capacity.
You do not need every metric in the first version. You need enough practical server monitoring to decide whether to fix something now, schedule maintenance soon, or keep watching a stable trend.
The low maintenance monitoring checklist
- CPU and load average: watch sustained load rather than a single busy minute, and note whether the trend is rising week over week.
- Memory and swap: check available memory, swap growth, and out-of-memory events so small leaks do not become surprise outages.
- Disk and inode usage: track both capacity and inode exhaustion on log, upload, database, and backup volumes.
- Core services: verify that web servers, databases, queues, cron jobs, and workers are running after deploys and reboots.
- Backups: confirm the latest backup completed, has the expected size, and is recent enough for your recovery needs.
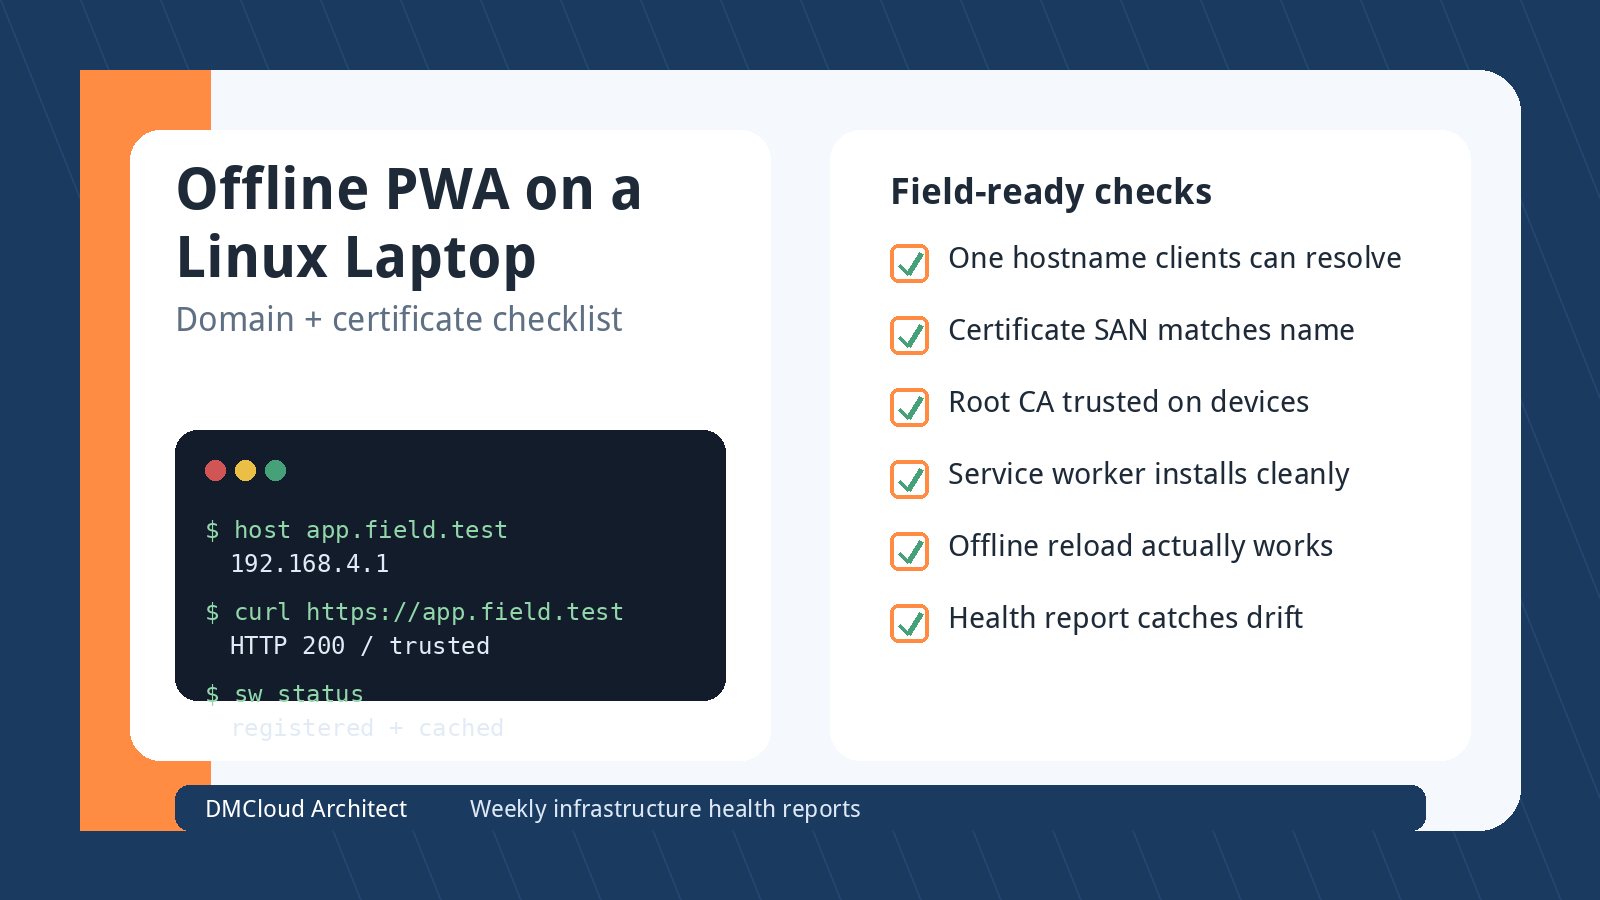
- Certificates and domains: review expiration windows before renewals become urgent customer-facing problems.
- Security basics: look for repeated failed logins, unexpected listening ports, and unattended update issues.
Use thresholds that reduce noise
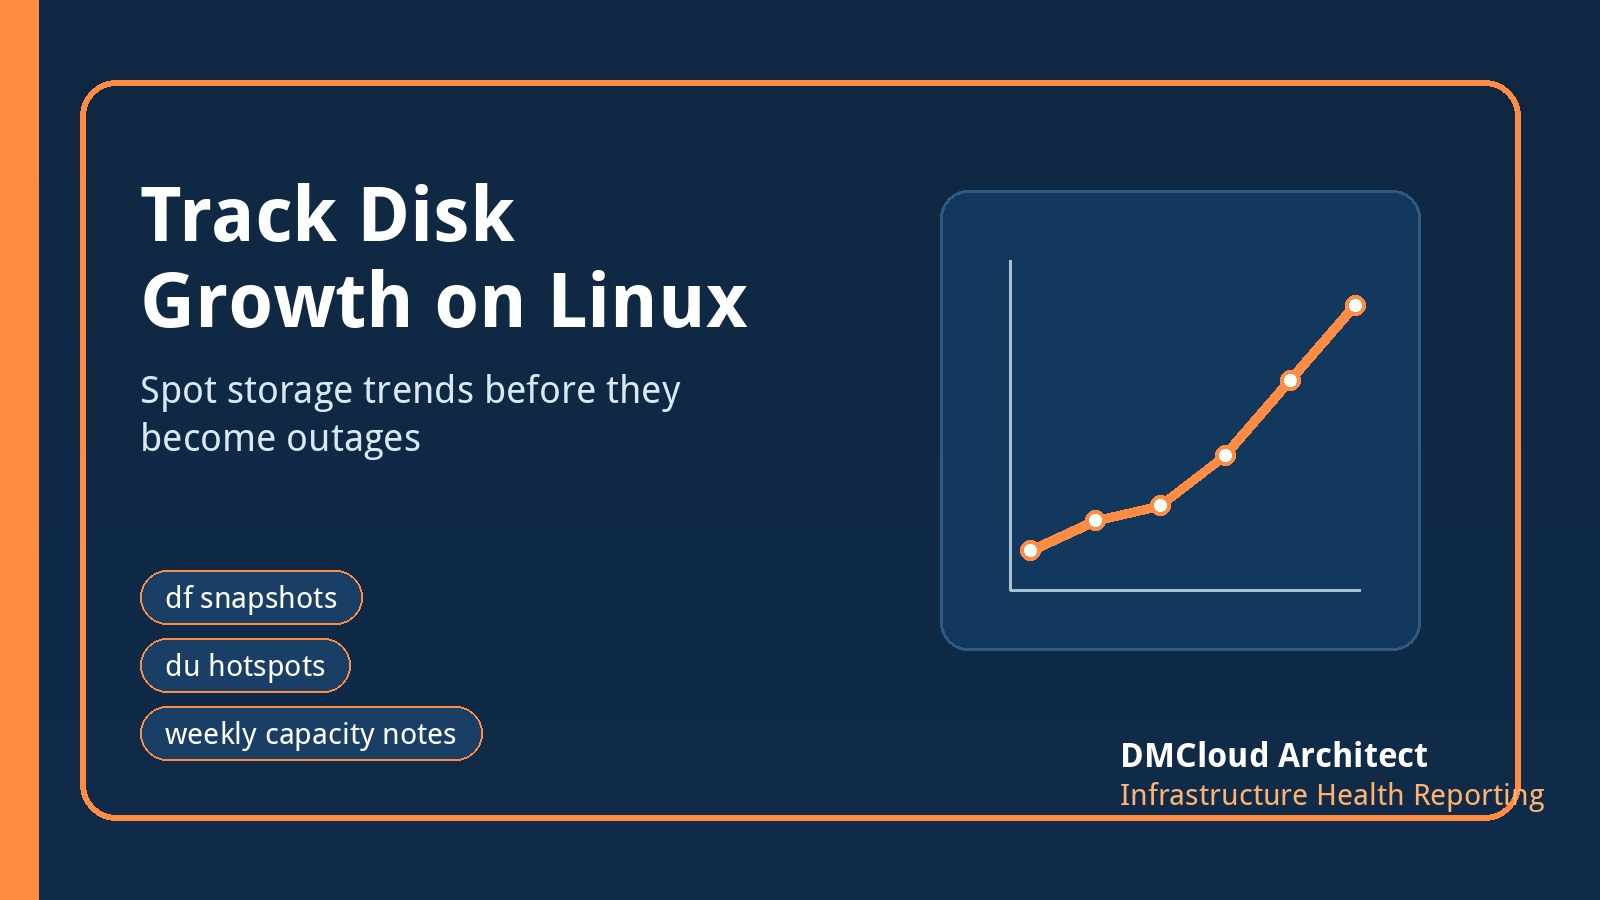
Monitoring without complexity depends on thresholds that mean something. A disk at 70% might belong in a weekly trend note. A disk at 85% with rapid growth deserves a cleanup task. A disk at 95% on a database server deserves immediate attention.
The same pattern works for CPU, memory, backups, and certificates. Set levels that map to action: observe, plan, fix soon, or fix now. If every alert looks urgent, people eventually ignore the alerts.
Prefer weekly summaries over constant dashboards
Easy infrastructure monitoring works best when it fits the way a small team already operates. A weekly health summary can show what changed, which servers are stable, and which risks need attention without asking someone to stare at charts all day.
This cadence is especially useful for small business Linux and MySQL environments. Disk growth, slow queries, backup drift, certificate windows, and service restarts often become visible days or weeks before customers notice a problem.
Keep the first system boring
It is tempting to begin with a full observability platform. Prometheus, Grafana, OpenTelemetry, and commercial tools are valuable when you have many services, strict incident workflows, or multiple teams sharing ownership.
For a small production environment, a boring first system is often more reliable: scheduled checks, clear thresholds, a short report, and a repeatable review habit. You can still add deeper tooling later when the operational need is real.
A simple ops monitoring routine
- Review weekly CPU, memory, disk, database, and backup trends.
- Flag only the changes that require a decision or a scheduled task.
- Confirm important services and cron jobs survived recent deploys or reboots.
- Check certificate dates, update status, and obvious access-control warnings.
- Write one short action list: fix now, plan soon, or keep watching.
The point of low maintenance monitoring is not to avoid responsibility. It is to make infrastructure responsibility manageable for the people who already have a product, customers, and a business to run.
Want weekly infrastructure health checks without dashboard fatigue?
DMCloud Architect sends Linux and MySQL infrastructure health reports directly to your inbox, so you can spot risks early without adding another monitoring dashboard to watch.
Get the free starter plan for weekly infrastructure health reports.