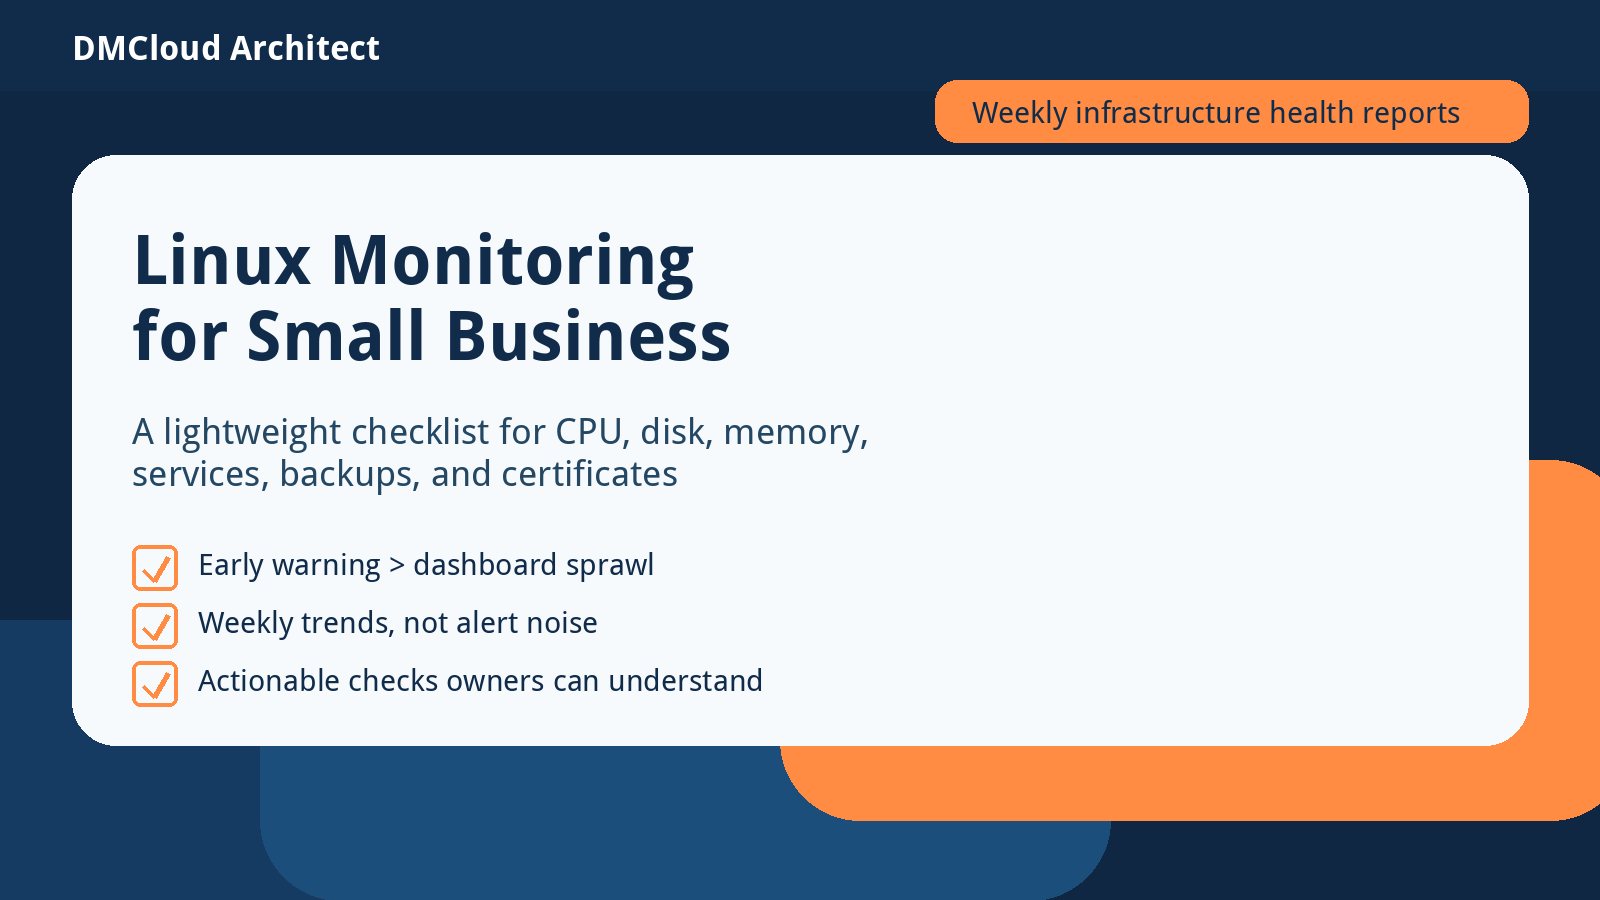
Small teams rarely need a giant monitoring stack on day one. They need a dependable way to notice when a server is getting slower, filling up, missing backups, or quietly losing the safety margin that keeps customers happy.
The practical goal of linux monitoring for small business is not to collect every metric. It is to choose the checks that tell you, early enough to act, whether your Linux servers are healthy enough for the work they support.
Start with the failure modes that actually hurt customers
Before choosing tools, list the events that would interrupt your business: a full disk, a saturated CPU, an out-of-memory process kill, an expired TLS certificate, a failed backup, or a critical service that stops after a reboot. These are the checks that belong in the first version of your monitoring plan.
For many small businesses, this first pass can be much lighter than Prometheus, Grafana, and a full incident pipeline. A scheduled health report, a few threshold checks, and clear escalation rules can catch the common risks while you decide whether a larger observability platform is worth the overhead.
The lightweight Linux monitoring checklist
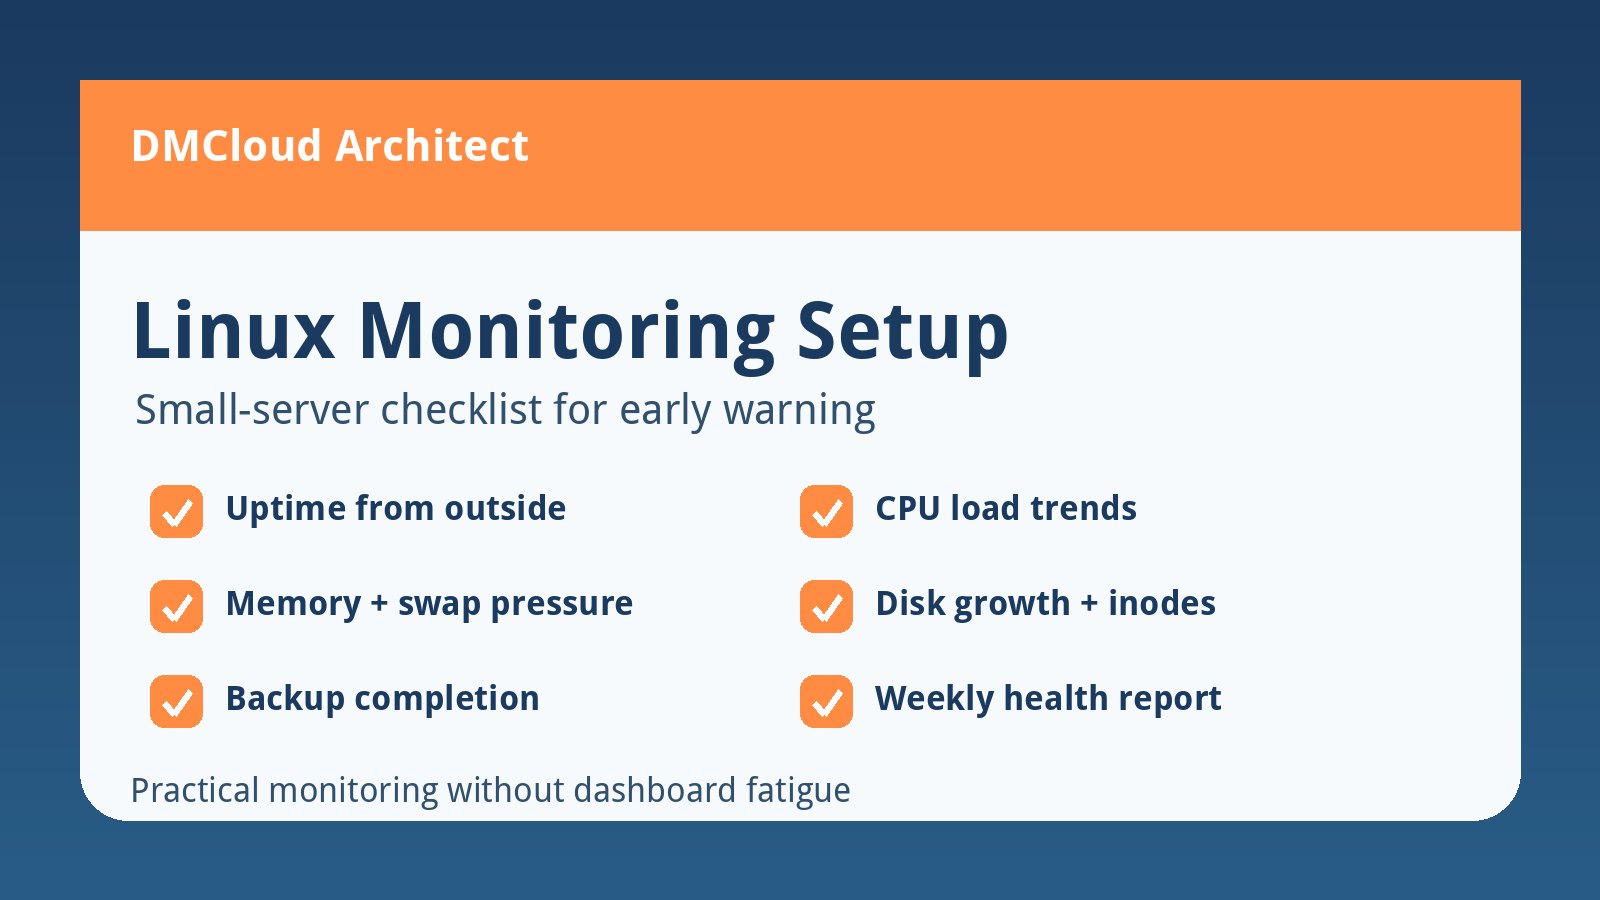
- CPU load and steal time: watch sustained load averages, runaway processes, and cloud-host contention signals.
- Memory pressure: track available memory, swap use, and out-of-memory events rather than only total RAM.
- Disk usage and inode usage: alert before filesystems cross your comfort threshold, especially logs, uploads, and database volumes.
- Database health: review slow queries, connection counts, replication lag when applicable, and tablespace growth.
- Service status: verify that nginx, Apache, MySQL, background workers, queues, and cron jobs are running after deploys and reboots.
- Backups: confirm the latest backup exists, completed successfully, and is recent enough to meet your recovery expectations.
- Certificates and domains: check expiration dates before they become emergency tickets.
- Security basics: monitor failed login spikes, unattended upgrade status, open ports, and unexpected listening services.
Use thresholds that trigger action, not noise
A simple Linux monitoring solution fails when every warning is treated like an emergency. Pick thresholds that map to action: review, plan capacity, clean up disk, restart a service, or schedule maintenance.
For example, a disk at 70% may only deserve a weekly trend note. A disk at 85% with rapid growth deserves a task. A disk at 95% on a database server deserves immediate attention. The same idea applies to CPU, memory, and backup freshness: the alert should tell someone what to do next.
Make trend reports part of operations
Point-in-time checks are helpful, but trends are what keep small teams out of fire drills. If load average, disk use, memory pressure, or database size rises every week, you want to know while there is still time to resize, archive, tune, or budget for capacity.
This is where lightweight reporting works well. A weekly summary can show what changed, what is stable, and which servers deserve attention without requiring a business owner or developer to watch dashboards every morning.
When to add heavier tools
Prometheus, Grafana, OpenTelemetry, and commercial monitoring products are powerful when you have many services, multiple teams, strict incident response needs, or complex application-level tracing. They are not always the best first step for a two-server business application.
Move toward heavier tooling when you need richer alert routing, service-level objectives, distributed traces, application performance metrics, or a shared operations dashboard. Until then, a minimal Linux monitoring setup can protect the business with less setup and less noise.
A simple weekly routine
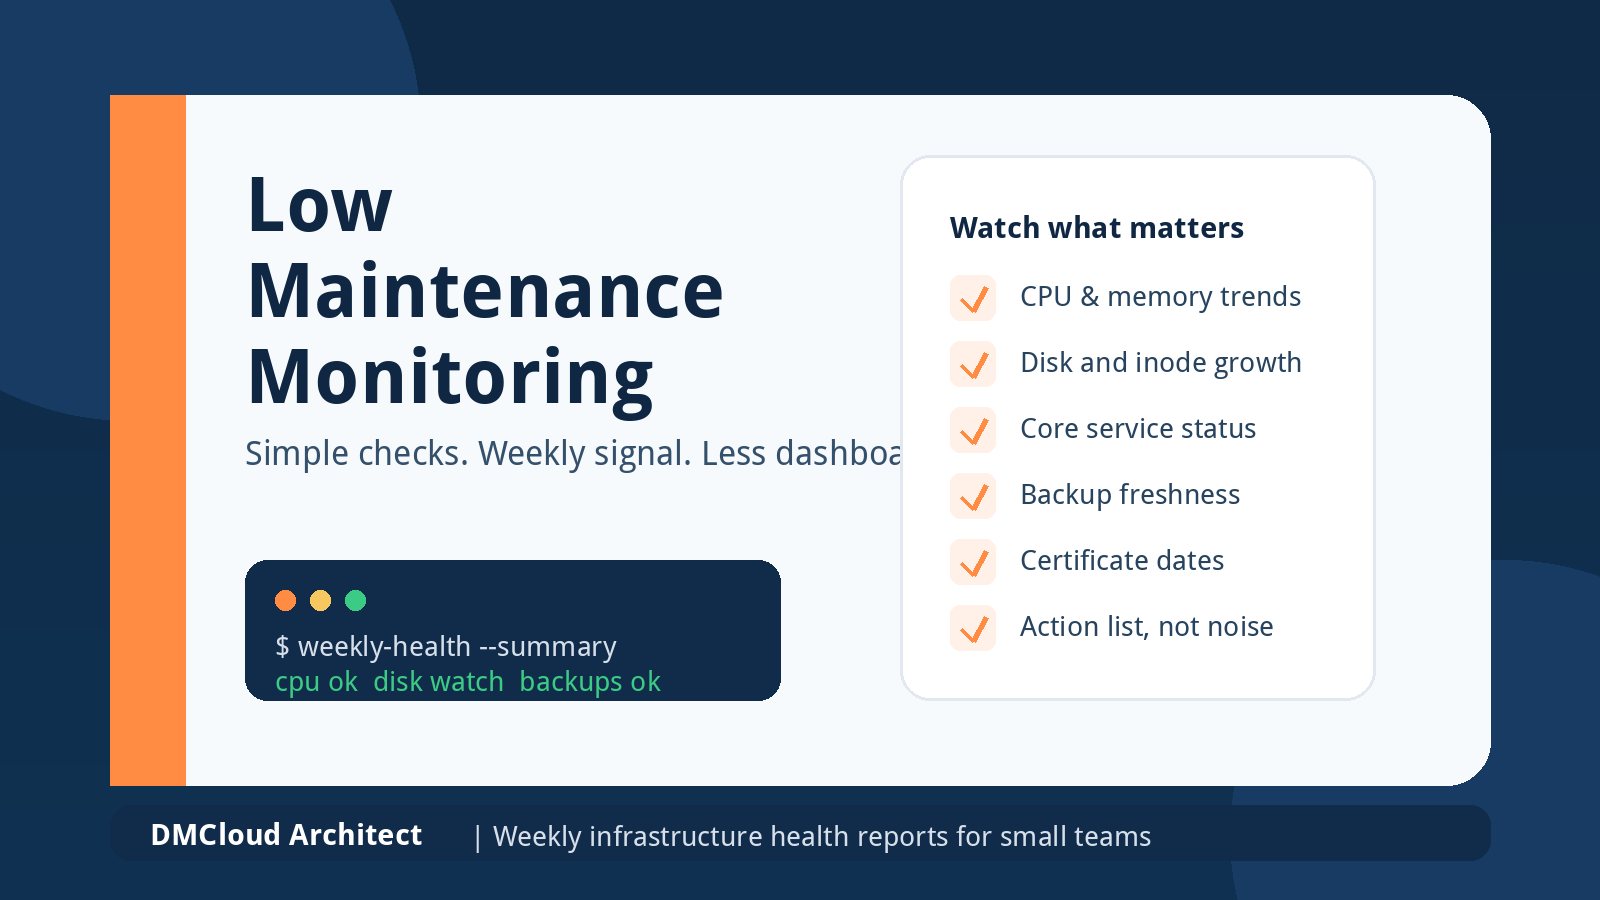
- Review CPU, memory, disk, and database growth trends.
- Confirm backups completed and test restore assumptions on a schedule.
- Look for stopped services, failed cron jobs, and repeated login failures.
- Check certificates, package update status, and unusual open ports.
- Create one short action list: fix now, plan soon, or keep watching.
The best monitoring habit is consistency. A short weekly review catches slow-moving infrastructure problems long before they become urgent customer-facing outages.
Want weekly infrastructure health checks without dashboard fatigue?
DMCloud Architect sends Linux and MySQL infrastructure health reports directly to your inbox, so you can spot risks early without adding another monitoring dashboard to watch.
Get the free starter plan for weekly infrastructure health reports.