Dedicated servers can feel like freedom when cloud egress costs start eating the budget. Unmetered bandwidth, predictable monthly pricing, and direct control are real advantages for scraping clusters, data jobs, internal tools, and busy client workloads. The tradeoff is that the managed safety net gets thinner: you now own the operating system, firewall behavior, service supervision, capacity signals, and the recovery plan.
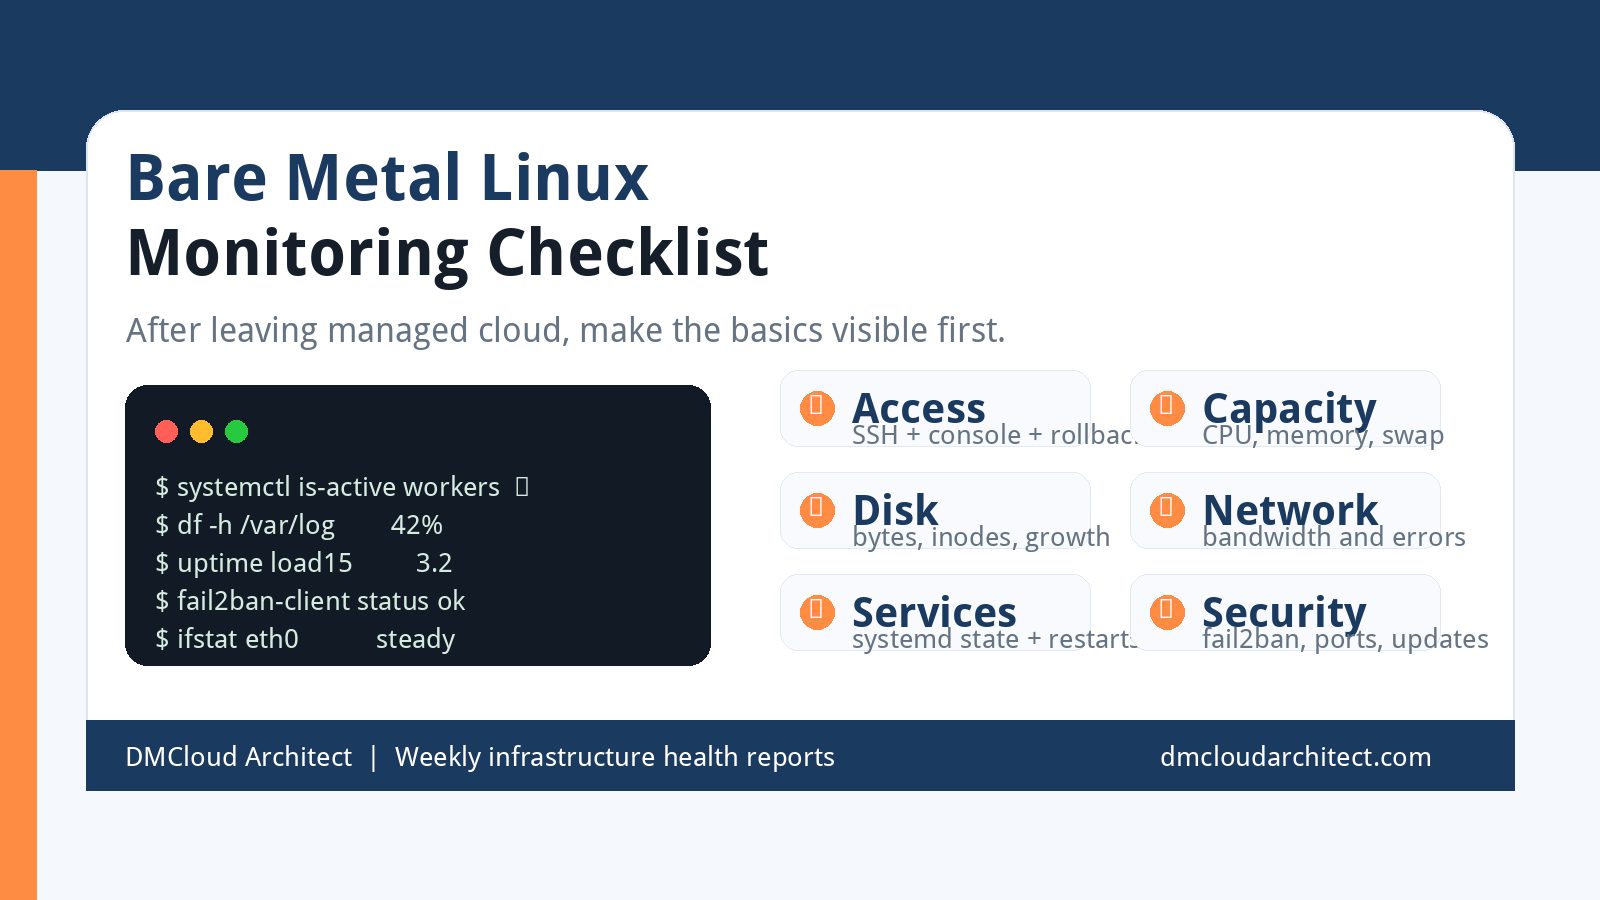
That does not mean every developer or small business owner needs to become a full-time operations team overnight. It does mean your first week on bare metal should include a plain, repeatable linux server monitoring checklist. The goal is to catch the boring failures early: a full disk, a service crash, runaway CPU load, blocked SSH access, saturated bandwidth, or a security rule that locks out your own automation.
Start with the "can I still get in?" checks
Before tuning kernel parameters or rewriting systemd units, protect access. A dedicated server is much less forgiving when the only administrator gets locked out during a firewall, proxy, or fail2ban change. Treat login health as a production signal, not an afterthought.
- Confirm at least two safe access paths: for example, SSH key access plus provider console access or rescue mode.
- Monitor SSH availability: check that port 22, or your chosen SSH port, answers from a trusted external location.
- Watch fail2ban decisions: alert on new bans, especially against your office IP, VPN, proxy pool, or automation hosts.
- Keep firewall changes staged: apply rules with a rollback timer until you have proven the next login works.
- Record emergency steps: provider console URL, rescue boot notes, mount commands, and who is allowed to use them.
This is not glamorous monitoring, but it prevents the most painful kind of outage: the server is running, the workload might even be fine, and nobody can safely reach it to fix the next issue.
Baseline CPU load before tuning anything
Cloud dashboards often hide the first wave of operational questions. On bare metal, you need to know what normal looks like. Record CPU load averages, CPU steal if available, run queue pressure, and the top processes during normal business traffic. For scraper fleets, queue workers, or Python spiders, compare concurrency settings against sustained load rather than against a single successful test run.
A simple first-week target is to capture load average, CPU utilization, process count, and the busiest services at the same time each day. If the server has 16 cores and the 15-minute load sits near 18 during normal traffic, that is a different story than a one-minute spike during a scheduled batch. Monitoring should help you separate healthy bursts from pressure that will become tomorrow's slowdown.
Watch memory, swap, and process behavior together
Memory problems rarely announce themselves as "memory problems" to the business. They appear as slow crawls, failed jobs, OOM kills, stuck queues, or sudden database restarts. Track free memory, cache behavior, swap use, and out-of-memory events together so you can see the pattern before customers notice missing reports or late deliverables.
- Check
dmesgor journal OOM events: an OOM kill is a capacity incident, not just a log line. - Track swap activity: a little configured swap can be fine; constant swap-in/swap-out is a warning.
- Group processes by role: web server, database, queue workers, proxy services, and scheduled jobs.
- Compare memory to concurrency: one script may be efficient, while 80 parallel copies are not.
The practical question is not "how much RAM is free right now?" It is "which workload consumes memory as traffic rises, and how much headroom do I have before the server starts killing important processes?"
Make disk growth visible immediately
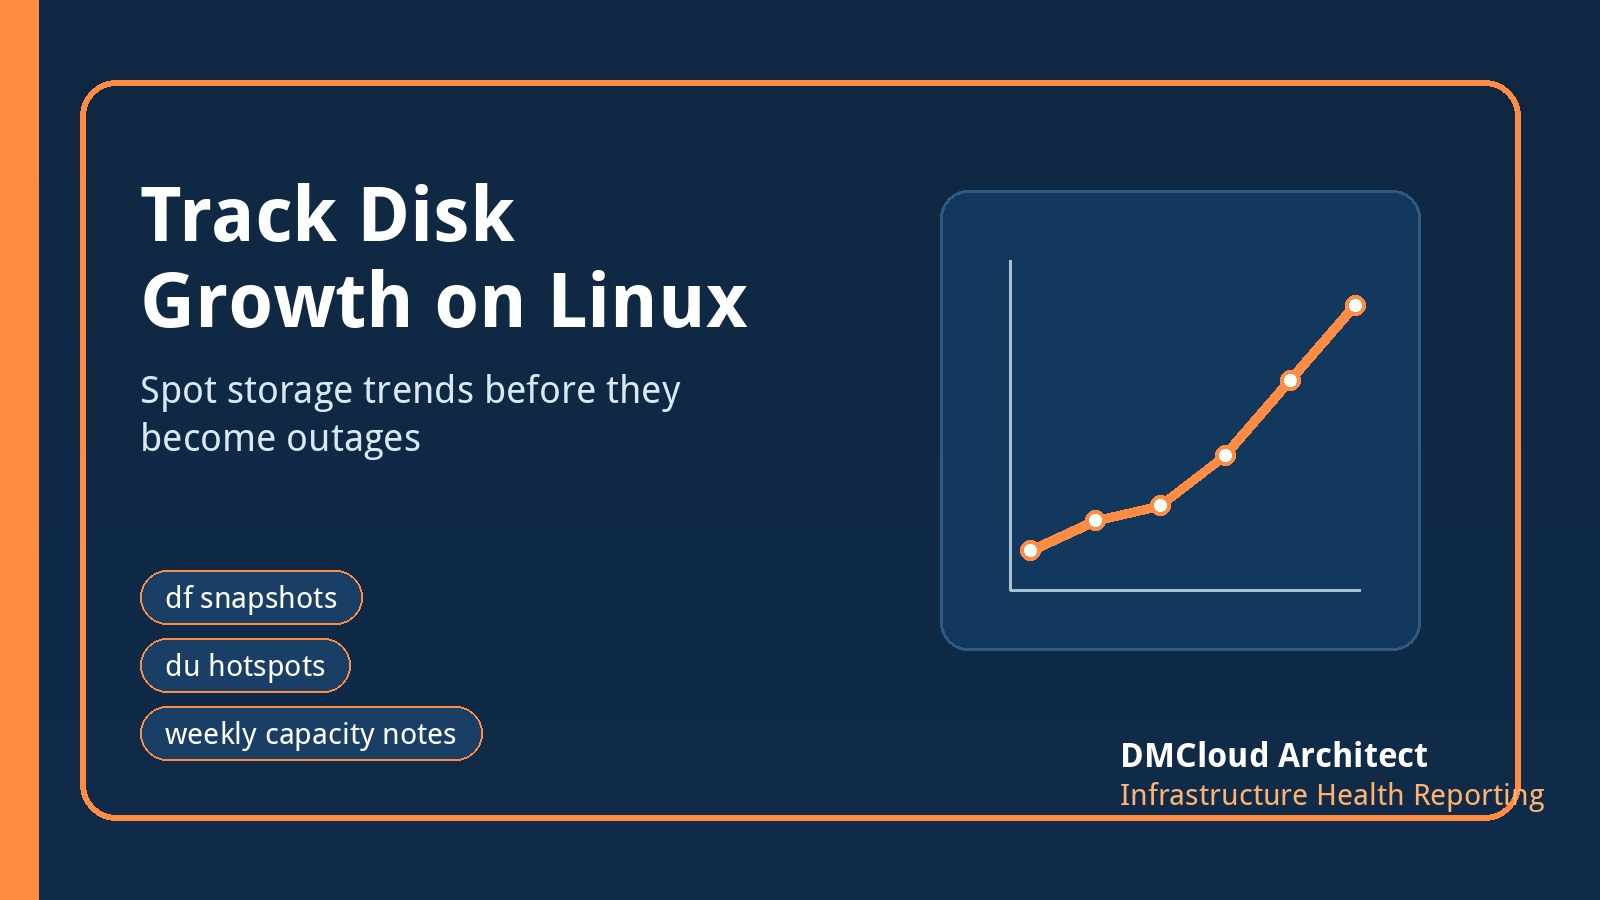
On a managed platform, log rotation, object storage, snapshots, and database volumes may have been someone else's default. On a raw Linux server, a chatty scraper, debug log, cache directory, or database binlog can quietly fill the filesystem. Disk monitoring should be in place before you celebrate the migration.
- Filesystem usage: monitor percent used and free bytes for every mounted filesystem that matters.
- Inode usage: millions of tiny cache files can exhaust inodes before bytes are full.
- Fastest-growing directories: track logs, temporary downloads, caches, database data, and backup folders.
- Rotation rules: verify logrotate or application retention with real files, not only config syntax.
- Backup space: make sure local backup jobs do not fill the same disk they are supposed to protect.
A daily disk-growth summary is one of the highest-value reports for a small team because the fix is often easy when there are still days of headroom, and stressful when the partition is already at 99 percent.
Measure bandwidth from the server's point of view
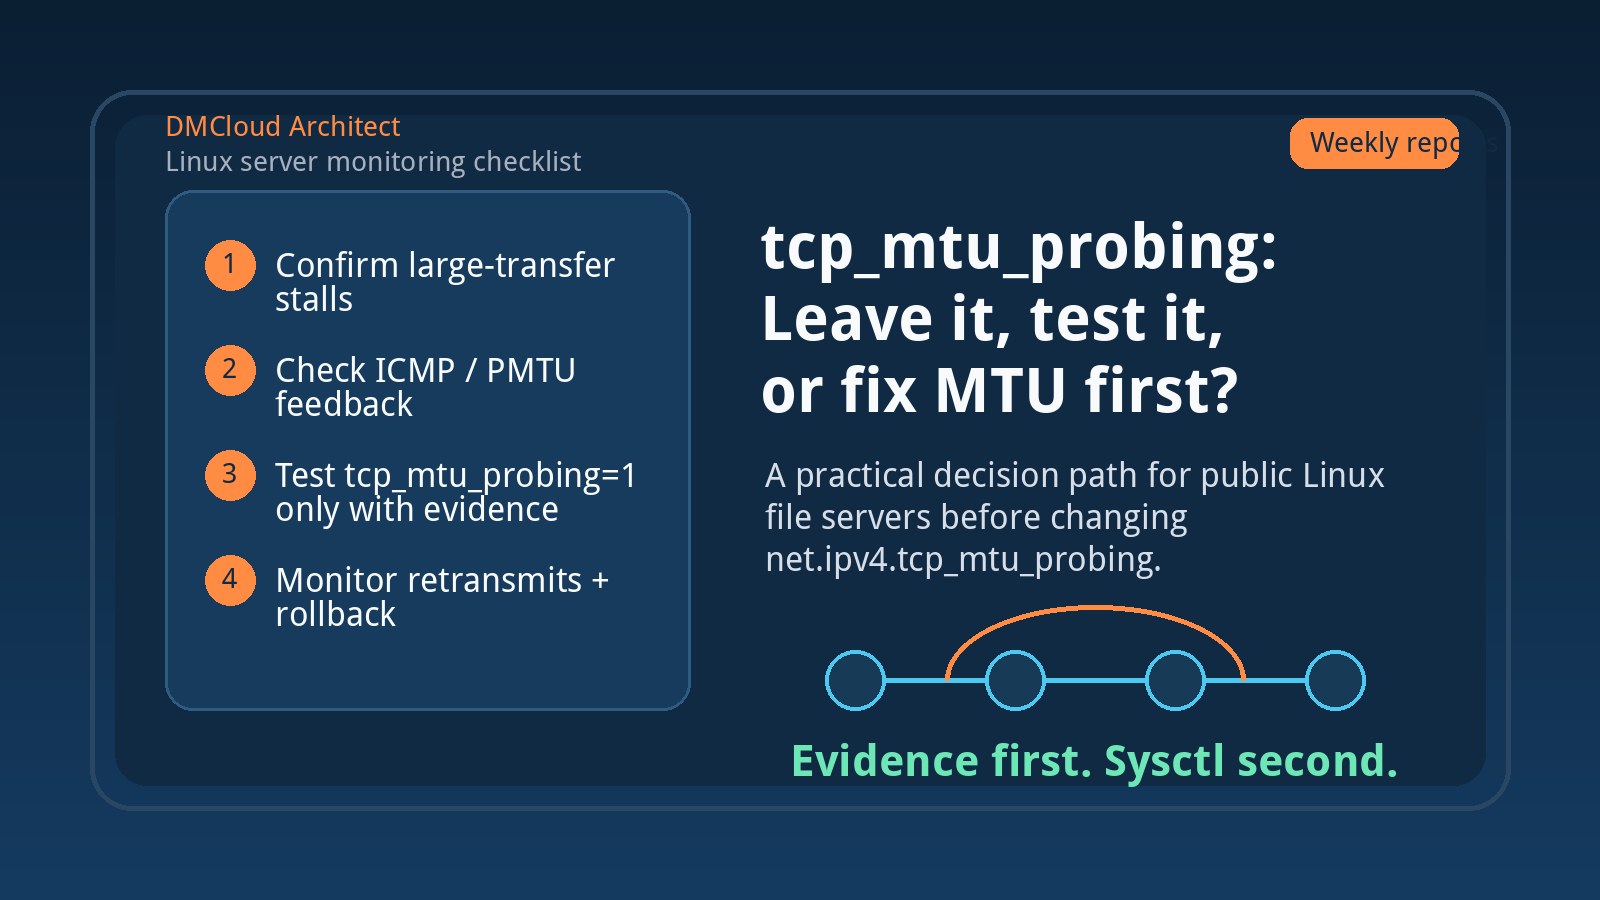
The whole reason many teams consider bare metal is bandwidth cost. That makes network monitoring a business metric as well as an infrastructure metric. Track interface throughput, total transfer by day, error counts, retransmits, and any provider-side limits that could turn "unmetered" into a throttling conversation.
For proxy-heavy or scraper-heavy workloads, separate expected outbound traffic from suspicious retry storms. If a broken target, bad proxy pool, or misconfigured queue causes a loop, unmetered bandwidth prevents a surprise bill but does not prevent wasted capacity or blocked relationships. Monitoring should show whether traffic matches useful work.
Turn systemd into a useful signal
Writing custom systemd services is a good move for long-running scripts, but the unit file is only half of the operational story. Add checks that confirm each important unit is active, restarts are not looping, logs are not growing unusually fast, and dependencies start in the right order after reboot.
- Service state: active, failed, activating, or restart-looping.
- Restart count: repeated restarts can hide a crash until data is late.
- Last successful run: especially for timers, importers, report generators, and cleanup jobs.
- Boot recovery: after a planned reboot, verify all critical units return without manual commands.
If the workload matters, it should not depend on someone remembering to start a terminal session. It should have a service definition, logs, and a simple health check that makes failure obvious.
Keep security monitoring practical
Bare metal does not require panic, but it does require a few consistent checks. Track package update status, listening ports, SSH login failures, fail2ban actions, sudo usage, certificate expiry, and unexpected public services. For small businesses, the key is to avoid a giant dashboard that nobody watches. A weekly summary with clear exceptions is often more actionable.
Be especially careful when your own automation uses rotating proxies, unusual request patterns, or many worker hosts. Security tools can mistake your traffic for hostile traffic. That is not a reason to disable them; it is a reason to document trusted sources, test regexes carefully, and alert on bans before they interrupt production work.
Decide what needs alerts and what belongs in a report
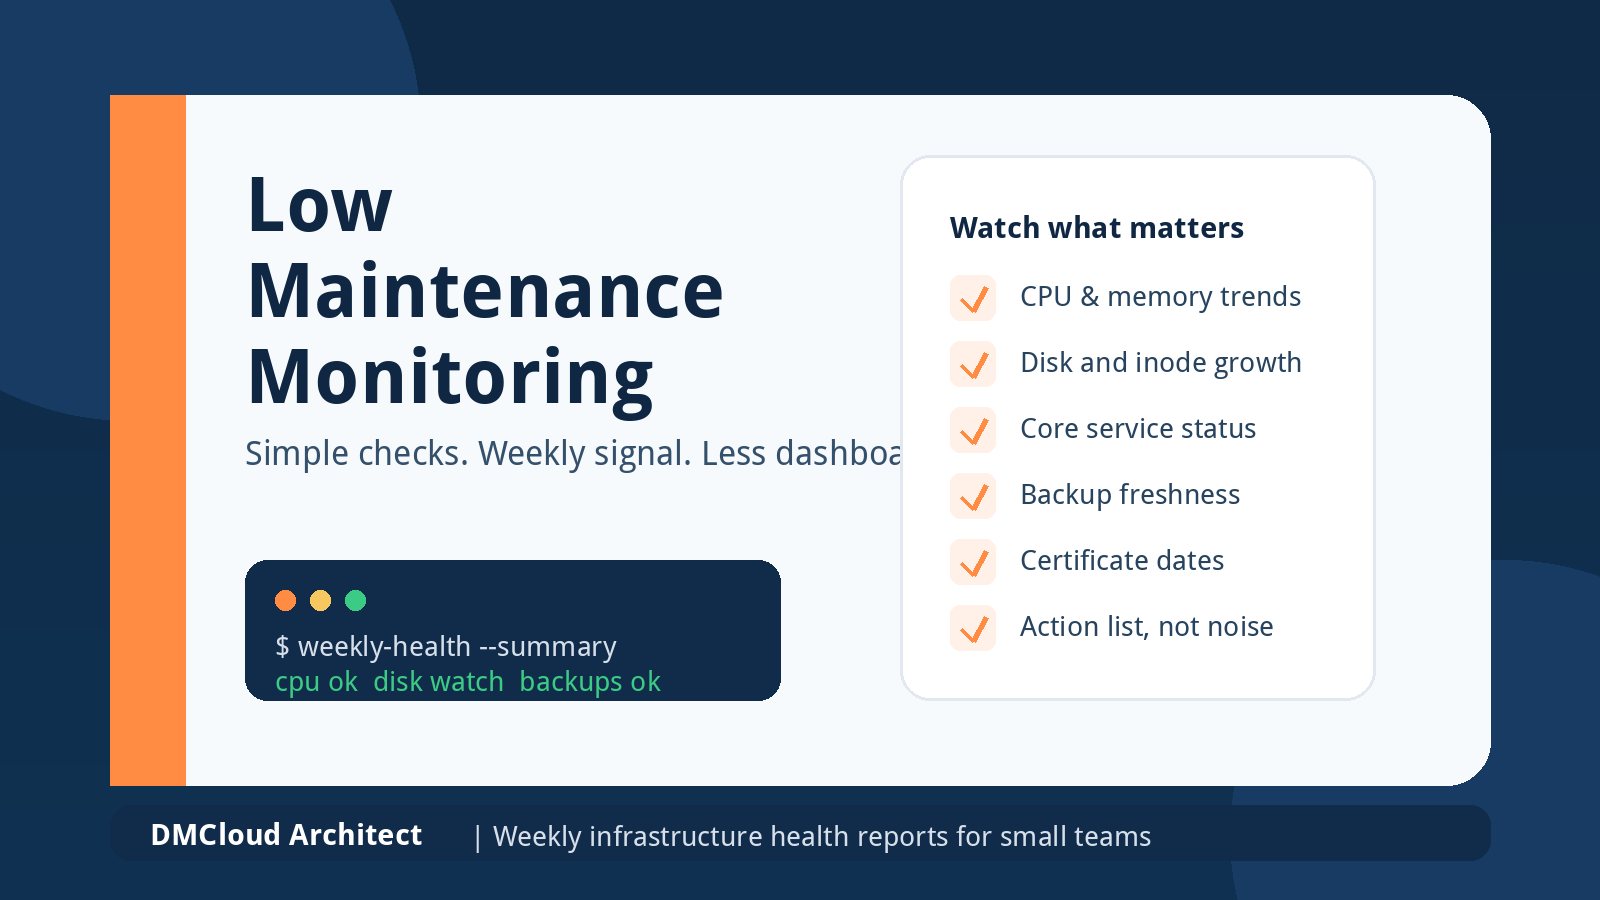
Not every signal deserves a 2 a.m. notification. SSH unreachable, disk critically full, important service failed, or certificate expired may need immediate attention. Slower-moving trends such as disk growth, load average drift, memory headroom, package updates, and bandwidth totals are often better as a scheduled health report.
This separation is what keeps monitoring useful. Alerts interrupt people for time-sensitive risks. Reports help owners make decisions without staring at graphs all day. For developers who suddenly inherited sysadmin duties, that difference can be the line between a sustainable setup and dashboard fatigue.
A first-week checklist for accidental admins
- Document access: SSH keys, provider console, rescue mode, firewall rollback, and emergency contacts.
- Install baseline checks: CPU load, memory, swap, disk bytes, inodes, network throughput, and service status.
- Review fail2ban and firewall events: confirm security rules block hostile behavior without blocking your own operations.
- Verify systemd units: every critical workload should restart cleanly and expose failure in logs.
- Test backup and restore: a backup that has never been restored is only a hope.
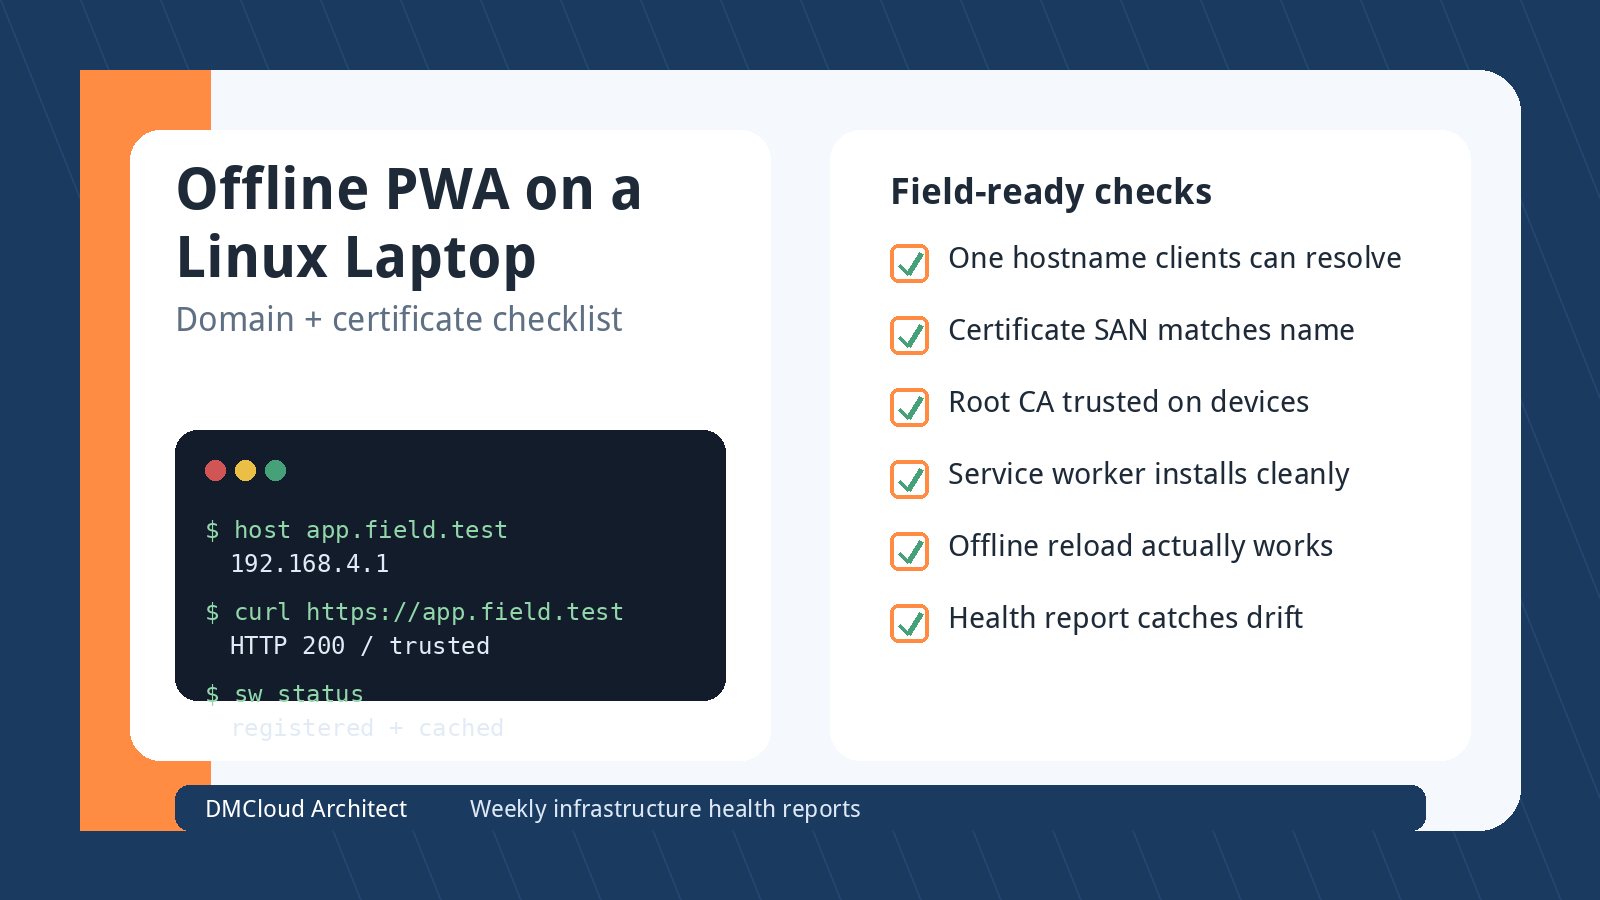
- Track certificates and domains: expiry dates, renewal commands, DNS ownership, and HTTPS checks.
- Review growth trends weekly: disk, load, bandwidth, queue depth, and database size.
- Write the runbook while it is fresh: include commands, paths, service names, and rollback steps.
Bottom line
Leaving managed cloud for a dedicated Linux server can be a smart cost move, especially when bandwidth is the pain point. The safer version of that move is not "set it up and hope." It is a small monitoring baseline, clear access recovery, service supervision, security checks, and a weekly rhythm for reviewing the trends that do not need emergency alerts.
Start small, make the basics visible, and improve the system as the workload proves what it actually needs. That is how an accidental sysadmin becomes a calm operator instead of a person learning every lesson during an outage.
Want weekly infrastructure health checks without dashboard fatigue?
DMCloud Architect sends Linux and MySQL infrastructure health reports directly to your inbox, so you can spot risks early without adding another monitoring dashboard to watch.
Get the free starter plan for weekly infrastructure health reports.