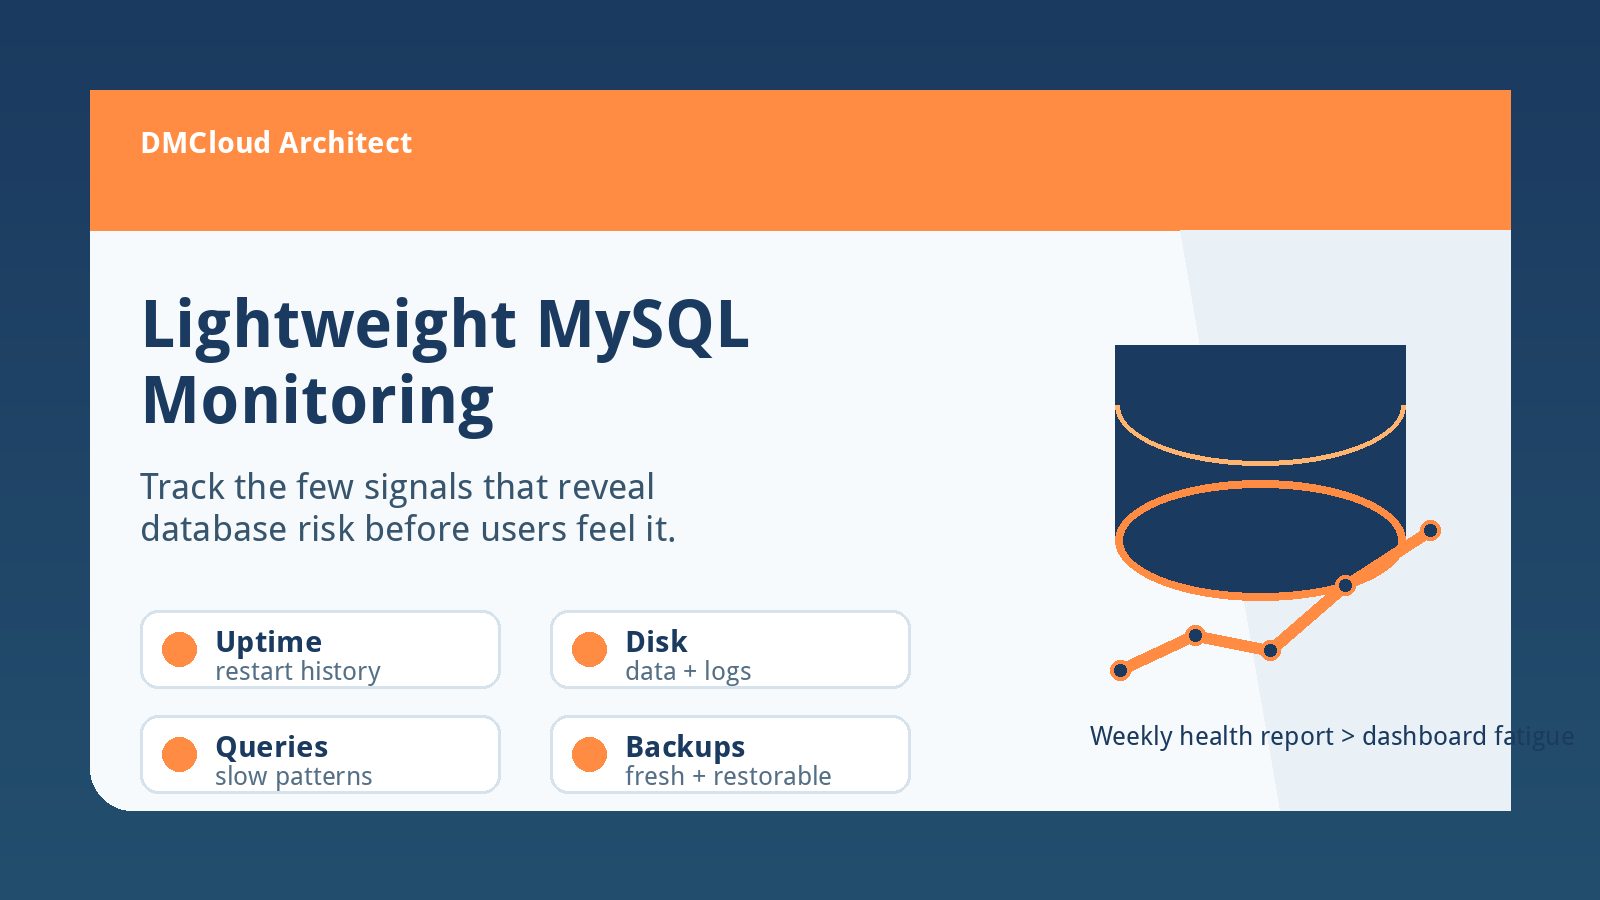
MySQL monitoring does not have to begin with a complex dashboard. For many developers and small business owners, the first useful step is a lightweight routine that answers one question clearly: is the database getting healthier, staying stable, or quietly drifting toward trouble?
A practical mysql monitoring lightweight approach focuses on a small set of signals that predict the most common incidents: storage pressure, slow queries, connection spikes, backup risk, replication lag, and server resource trends. The goal is not to collect every metric. The goal is to notice meaningful changes early enough to act during normal business hours.
Start with availability and restart history
The simplest MySQL health check is whether the service is up, but that is not enough by itself. A database that restarts overnight and comes back online may look healthy by morning while still hiding a memory, disk, or configuration issue.
Track uptime, recent restarts, and service status together. On a Linux server, systemctl status mysql or systemctl status mysqld shows service state, while MySQL's SHOW GLOBAL STATUS LIKE 'Uptime'; gives the database uptime in seconds. If uptime resets unexpectedly, check system logs, MySQL error logs, OOM killer events, and maintenance windows before assuming everything is fine.
Watch disk space before MySQL runs out of room
Storage is one of the easiest database risks to miss until it becomes urgent. MySQL data files, binary logs, slow query logs, backups, and temporary files can all grow steadily. If the volume fills up, writes may fail, replication may break, and recovery can become stressful.
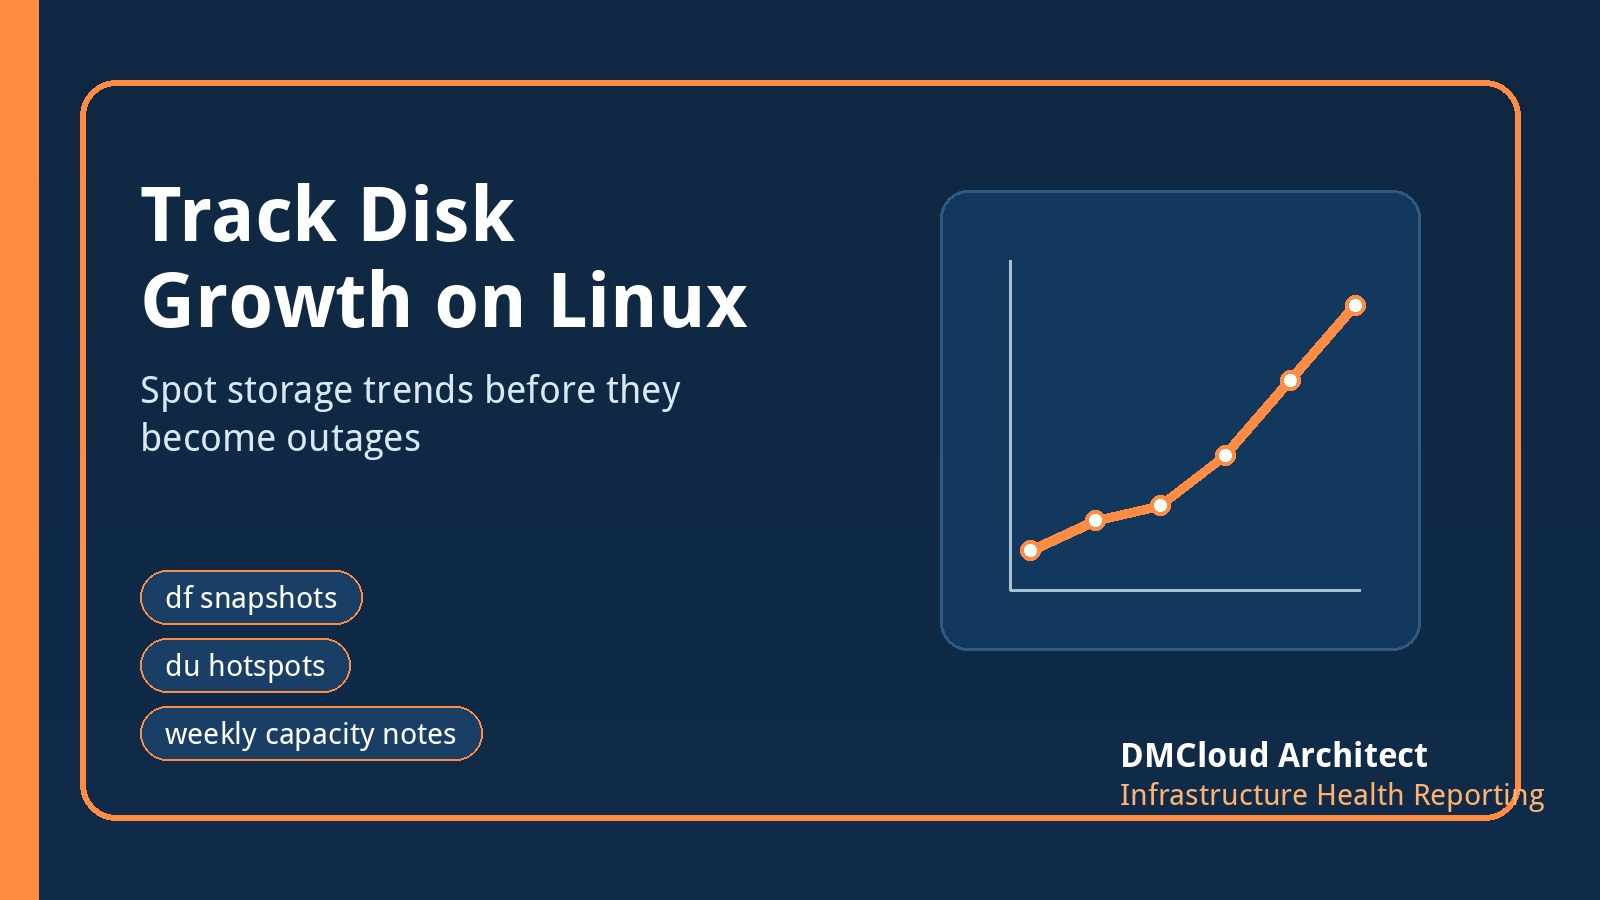
A lightweight check should record filesystem usage for the MySQL data volume and any backup or binary log locations. Pair df -h with a directory-level review such as du -sh /var/lib/mysql and the path where backups are stored. The trend matters more than a single number: a jump from 45% to 70% in a week deserves attention even if the disk is not full yet.
Review slow queries without drowning in noise
Slow query monitoring is often where simple MySQL monitoring becomes too complicated. Small teams do not always need a full query analytics platform on day one, but they do need a way to notice when query behavior changes.
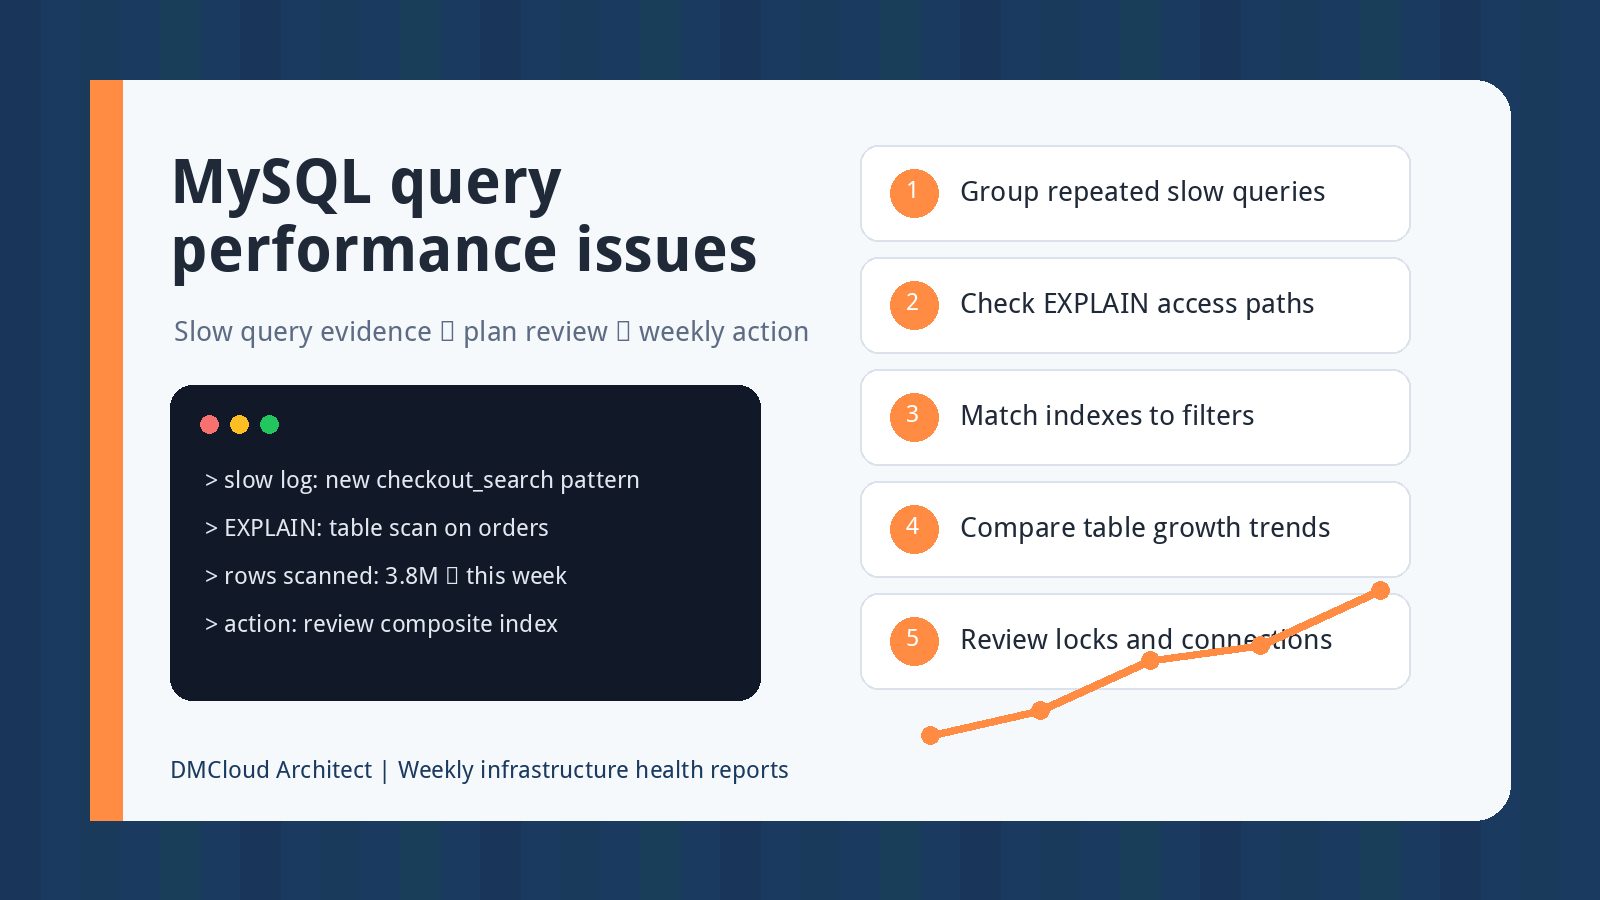
Enable the slow query log thoughtfully, set a reasonable threshold for the workload, and review the top repeated patterns rather than every individual statement. A weekly check might ask: are there new slow queries, are existing slow queries happening more often, and did a recent deploy or data growth change the pattern?
For lightweight MySQL performance monitoring, this kind of summary is usually more useful than a long list of raw SQL. It points the team toward the tables, endpoints, or reports that need attention first.
Track connections and aborted connections
Connection pressure can indicate normal traffic growth, an application pool misconfiguration, a stuck worker, or clients that are failing to close sessions cleanly. The key is to compare the current numbers against your normal baseline.
Useful status checks include Threads_connected, Max_used_connections, Aborted_connects, and the configured max_connections. If Max_used_connections keeps approaching the limit, increasing the limit may be only a temporary fix. Review application pooling, long-running queries, and traffic timing before making the server accept more connections than it can serve well.
Include InnoDB and buffer pool basics
For many MySQL workloads, InnoDB is where the important performance story lives. You do not need to interpret every internal counter to get value from lightweight monitoring, but you should track the basics over time.
Watch for signs that the buffer pool is undersized for the active workload, that dirty pages are building up, or that disk I/O is becoming a bottleneck. Pair those readings with operating-system indicators such as CPU load, memory pressure, swap use, and disk wait. MySQL health reporting is strongest when database signals and server signals are reviewed together.
Do not forget backups and restore confidence
A database can look healthy right up until the day a restore is needed. Lightweight MySQL monitoring should include backup freshness, backup size, backup errors, and occasional restore validation. A backup job that has not run for three days is just as operationally important as a high CPU graph.
Record the most recent successful backup timestamp, the size of the backup, and whether the job produced errors. If backup size suddenly drops, investigate it; that can indicate a failed dump, a changed path, or a retention issue. If backup size grows quickly, include that in disk forecasting so backups do not become the reason storage fills up.
If you use replication, make lag visible
Replication adds another small set of checks: replication state, lag, relay log growth, and error messages. The exact commands depend on the MySQL version and topology, but the operational question is simple: can the replica keep up, and would anyone notice quickly if it stopped?
Even a once-a-day replication note is better than discovering a broken replica during an incident. Include whether replication is running, current lag, and any recent errors in the same health report as your disk, backup, and slow query checks.
Turn the checks into a weekly health note
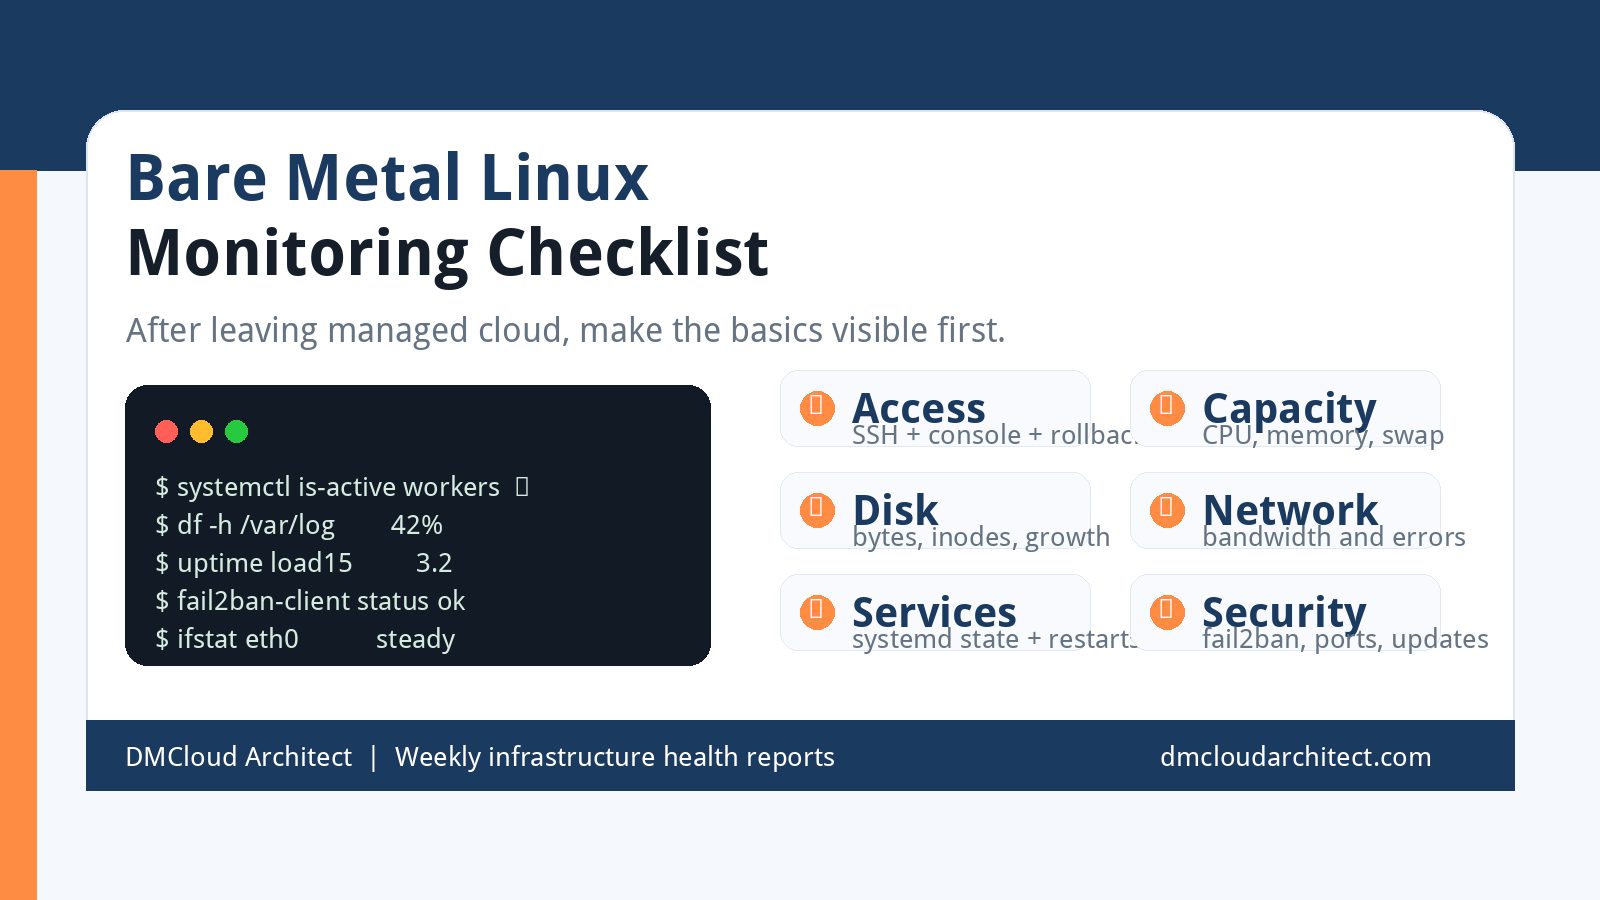
The best lightweight monitoring habit is a short, repeatable summary. A useful weekly MySQL health report might include service uptime, disk growth, backup freshness, slow query changes, connection pressure, replication status, and one recommended action.
That final action is important. Monitoring that says "everything is mostly fine" is easy to ignore. A report that says "binary logs grew 18 GB this week; confirm retention before Friday" creates a clear operational next step.
When lightweight monitoring is enough
A lightweight approach works well when you have a small number of servers, a practical weekly review rhythm, and a team that needs early warnings more than a wall of charts. It is also a good starting point before investing in heavier tooling, because it teaches the team which signals actually matter for its workload.
As the environment grows, you may still add alert routing, query analytics, tracing, and dashboards. But the foundation stays the same: measure the few database and server trends that predict real business risk, review them consistently, and turn changes into action before customers feel the impact.
Want MySQL and server health trends reviewed for you?
DMCloud Architect turns MySQL, Linux, backup, disk, and performance checks into weekly infrastructure health reports for small teams that want early warnings without dashboard fatigue.
Get the free starter plan for weekly infrastructure health reports.