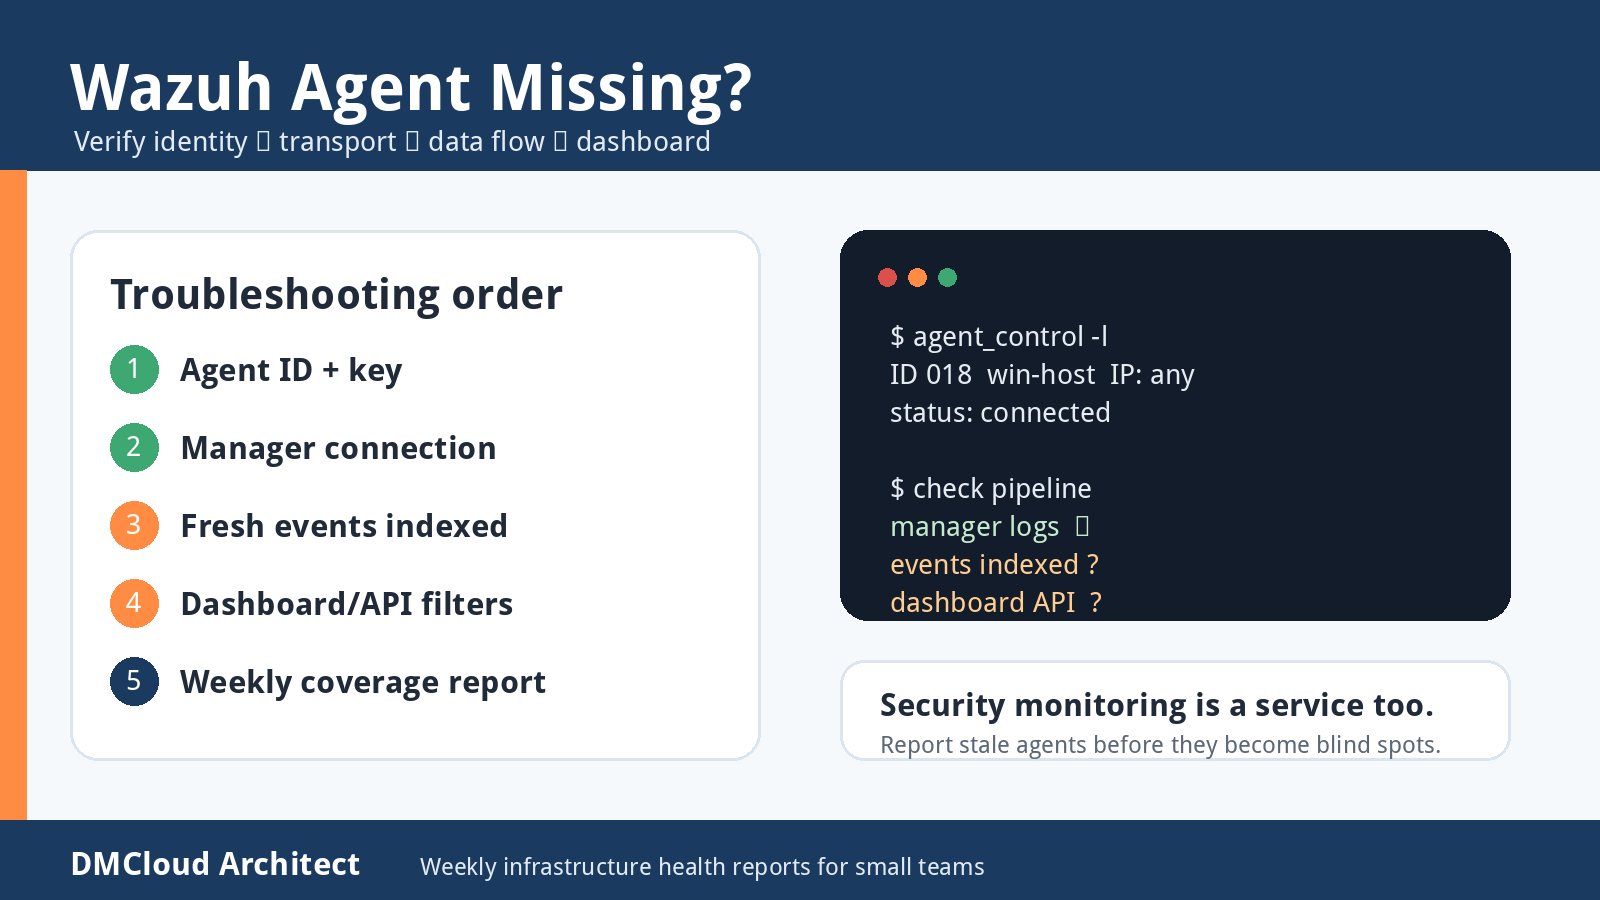
A security monitoring rollout can look successful from the command line while still feeling broken in the dashboard. The agent installed, the key matches, the manager is reachable, and the local log says the agent is online. Then the operations team opens the Wazuh dashboard and the host is missing, stale, or sitting behind an unhelpful IP: any, Unknown entry.
That situation is frustrating because it sits between infrastructure, endpoint configuration, and indexing. It is also exactly where a practical linux server monitoring mindset helps: verify each layer in order, prove where data stops, and avoid reinstalling or relaxing controls until the evidence points there. The checklist below is written for developers and small business owners who need a calm way to troubleshoot Wazuh visibility without turning one missing host into an all-day incident.
First, separate enrollment from visibility
Enrollment proves that the manager has an agent identity and key. It does not, by itself, prove that events are flowing into the indexer, that the dashboard time range includes those events, or that the agent metadata is healthy. Treat the problem as four separate questions:
- Identity: does the manager have the expected agent ID, name, and key?
- Transport: can the agent keep a stable connection to the manager on the expected protocol and port?
- Data flow: are events, syscollector data, SCA results, or heartbeats being received and processed?
- Presentation: is the dashboard querying the right index pattern, time range, and Wazuh API endpoint?
When teams blur those layers together, the usual response is to reinstall the agent. Sometimes that works by accident, but it can also create duplicate IDs, stale keys, and confusing dashboard records. A checklist keeps the fix targeted.
Check the manager's view of the agent identity
Start on the manager because it is the authority for agent registration. Confirm that /var/ossec/bin/agent_control -l lists the expected hostname or agent name and that the ID is not duplicated. If the same endpoint was enrolled multiple times during testing, remove stale records carefully and keep the current key aligned with the endpoint you expect to see.
- Compare agent name and ID: make sure the dashboard search is not using an old hostname, short hostname, or previous Windows computer name.
- Look for duplicates: multiple entries for one host can make the visible record look offline while the active record is elsewhere.
- Confirm active manager cluster node: in clustered deployments, verify the agent is connected to the manager node the dashboard/API is querying.
- Do not ignore
IP: anyby itself: it can be normal for NAT, DHCP, or configured agent address behavior. Pair it with connection and event-flow evidence.
The useful question is not merely whether the key exists. It is whether the manager and dashboard are talking about the same agent identity.
Prove the connection stays up after startup
A log line that says Connected to the server is a good sign, but it is a point-in-time signal. Watch whether the connection remains stable and whether the manager logs see that agent transition online. On Windows, also verify the service account, local firewall, endpoint security software, and the exact protocol/port configured in the agent.
- Manager port: confirm the agent is using the intended manager address and port, commonly 1514 for agent traffic.
- Protocol agreement: check TCP versus UDP settings on both sides instead of assuming the default.
- Local service state: verify the Windows service remains running after the first minute, not just immediately after install.
- Manager logs: review manager-side logs for authentication, disconnection, queue, or remoted messages for that agent ID.
- Clock sanity: confirm time sync on the endpoint, manager, and dashboard host so recent data does not appear outside the selected time range.
This is where small teams should resist the temptation to troubleshoot only from the endpoint. If the endpoint says it is connected but the manager never records usable traffic, the next check belongs on the path or the manager.
Confirm that data is reaching the pipeline
The dashboard needs indexed data, not just a registered key. If the agent is online but invisible, check whether any event type is arriving: active response status, syscollector inventory, SCA results, file integrity events, or simple heartbeat activity. A Windows agent can connect while selected modules are disabled, blocked, slow to finish, or filtered from the dashboard view.
- Search by agent ID: query the Wazuh API or dashboard using the numeric ID rather than only hostname text.
- Expand the time range: temporarily move from the last 15 minutes to the last 24 hours to rule out timing and ingestion delays.
- Review module output: syscollector, SCA, FIM, and rootcheck may complete on different schedules.
- Check indexer health: make sure the Wazuh indexer/OpenSearch layer is green or at least accepting writes.
- Look for parsing or queue pressure: manager queues and indexer errors can delay visibility even when agents are connected.
A good troubleshooting note should state, "The manager sees the agent, and these event types are or are not indexed." That is much more actionable than "the dashboard is blank."
Review dashboard and API assumptions
Dashboards can mislead when saved filters, stale index patterns, time ranges, user permissions, or a mismatched Wazuh API endpoint are involved. Before changing agent configuration, open a clean dashboard view and remove old filters. Then verify the Wazuh API connection used by the dashboard can return the agent list directly.
- Remove filters: clear host, group, OS, and status filters that may hide a newly enrolled endpoint.
- Use the agent ID: if a hostname search fails, search by the manager-assigned ID.
- Validate API endpoint: the dashboard should query the manager or cluster endpoint that knows about the agent.
- Check user permissions: restricted roles can make assets appear missing even when data exists.
- Refresh index patterns: if mappings or data views are stale, new fields and records may not show as expected.
For small businesses, this is a reminder that monitoring itself needs monitoring. If the collector, manager, API, indexer, and dashboard are separate parts, each part deserves a basic health check.
Use a safe remediation order
If the evidence points to an identity or transport issue, fix the smallest layer first. Restarting the agent service is lower risk than deleting records. Correcting a manager address is safer than reinstalling. Cleaning one duplicate stale agent is better than wiping the enrollment history for every test host.
- Save the current agent ID, name, key status, manager address, and relevant logs.
- Restart the endpoint agent service and watch manager logs during reconnect.
- Correct manager address, port, protocol, or firewall rules if connection evidence is inconsistent.
- Clear dashboard filters and verify by agent ID through the API.
- Only then consider removing stale duplicate records or re-enrolling the endpoint.
This order protects audit history and avoids creating a second mystery while solving the first one.
Turn the incident into a repeatable monitoring check
After the host appears, write down what proved the fix. A useful weekly server health report should not only say that CPU and disk are fine; it should also report whether security monitoring agents are visible, recently connected, and sending fresh data. For teams without a dedicated SOC, those boring checks are what prevent silent monitoring gaps.
- Agent freshness: last seen time for critical Linux and Windows hosts.
- Coverage gaps: enrolled agents with no recent events or inventory updates.
- Manager/indexer health: queue pressure, disk headroom, and index write errors.
- Dashboard/API checks: confirm the user-facing view matches manager-side reality.
- Exception notes: maintenance windows, retired hosts, lab machines, and known temporary outages.
The bigger lesson is simple: security tools are only useful when their own health is visible. A Wazuh dashboard gap is not just a UI annoyance; it is a monitoring coverage question. Handle it with the same discipline you would use for any production service: identity, transport, data flow, presentation, and follow-up reporting.
Want weekly infrastructure health checks without dashboard fatigue?
DMCloud Architect sends Linux and MySQL infrastructure health reports directly to your inbox, so you can spot risks early without adding another monitoring dashboard to watch.
Get the free starter plan for weekly infrastructure health reports.