Linux servers rarely fail without leaving clues first. Load averages drift upward, disks fill faster than expected, services restart quietly, certificates approach expiration, and database latency gets a little worse each week. The challenge is not finding another dashboard; it is knowing which signals deserve attention and which ones can stay in the background.
For developers and small business owners, the best setup is a simple routine that highlights operational risk before it becomes an outage. If you want to monitor linux server health, start with a small set of checks you can review consistently, then add detail only when a trend points to a real problem.
Start with the signals that predict user-visible trouble
A practical Linux server monitoring routine should begin with capacity and availability. CPU load, memory pressure, disk usage, inode usage, network errors, uptime, and failed services tell you whether the machine is under stress. These checks are useful because they connect directly to symptoms your customers feel: slow pages, failed uploads, timeouts, and unexpected maintenance windows.
Do not treat one noisy metric as a crisis. A short CPU spike during a backup may be harmless, while a steady weekly increase in load average may be a sign that the server is outgrowing its current shape. Trend direction matters more than a single snapshot.
Use a weekly checklist, not a wall of alerts
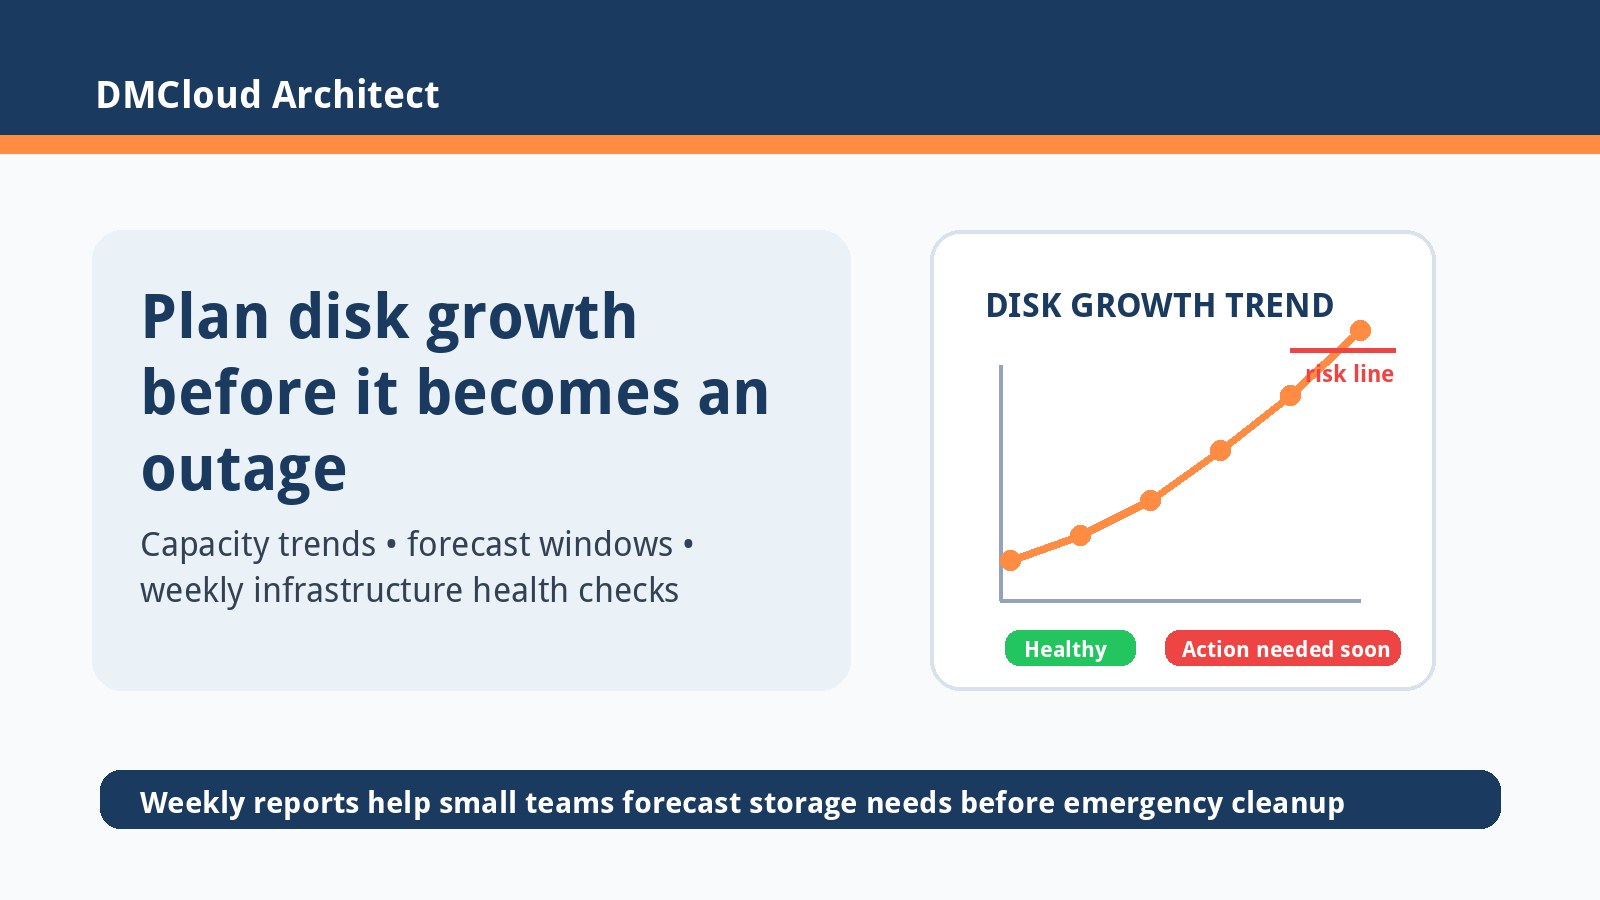
Alerting is helpful for urgent failures, but daily operations also need calm review. A weekly server health checklist lets you catch slow-moving issues such as disk growth, package update drift, backup failures, SSL expiration, and database table growth. These risks often sit below emergency thresholds until the week they become expensive.
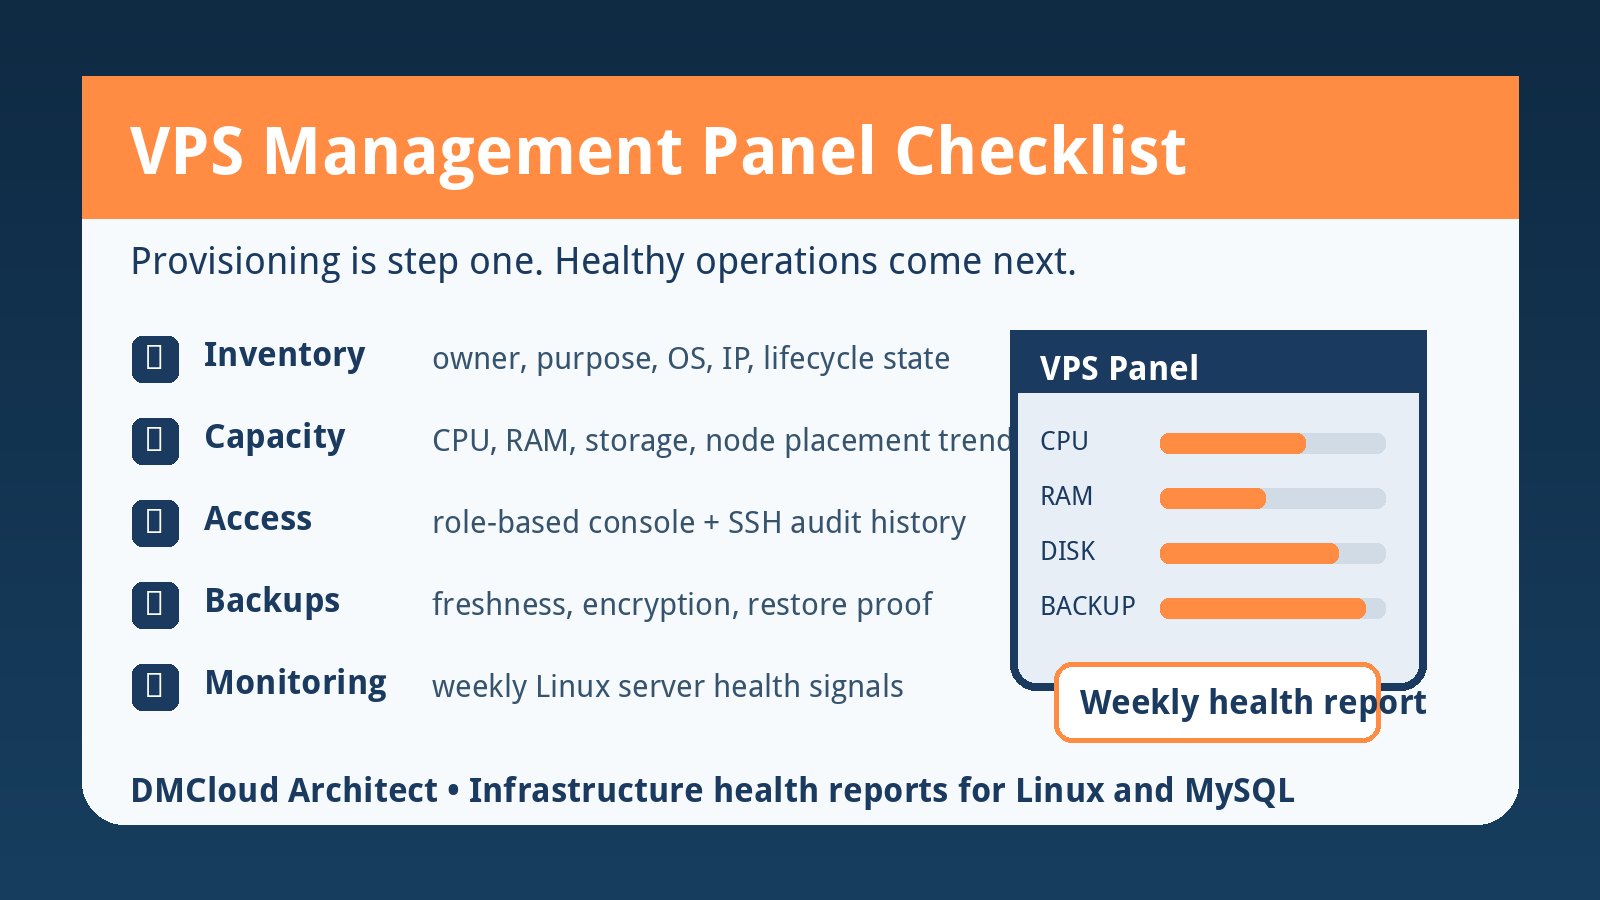
- Capacity: review CPU load, memory use, swap activity, disk space, inode pressure, and filesystem growth.
- Reliability: check failed systemd units, unexpected reboots, cron failures, backup status, and service restart loops.
- Security hygiene: confirm pending updates, exposed services, certificate dates, suspicious login failures, and firewall changes.
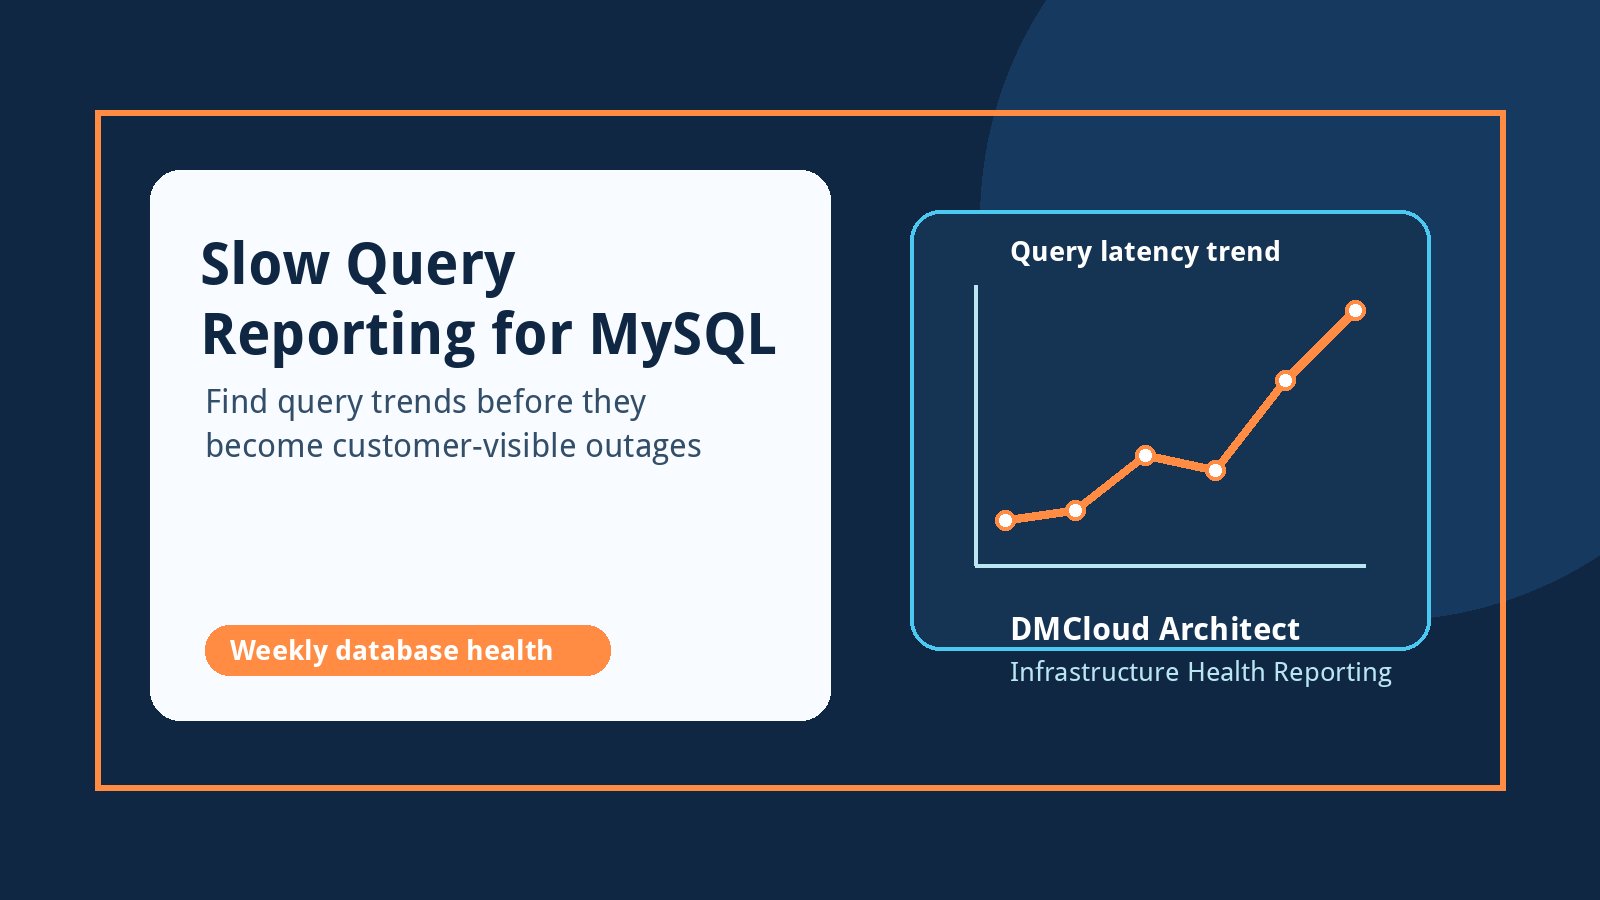
- Database health: track MySQL uptime, slow queries, replication state if used, table growth, connection pressure, and backup freshness.
Keep the monitoring setup lightweight
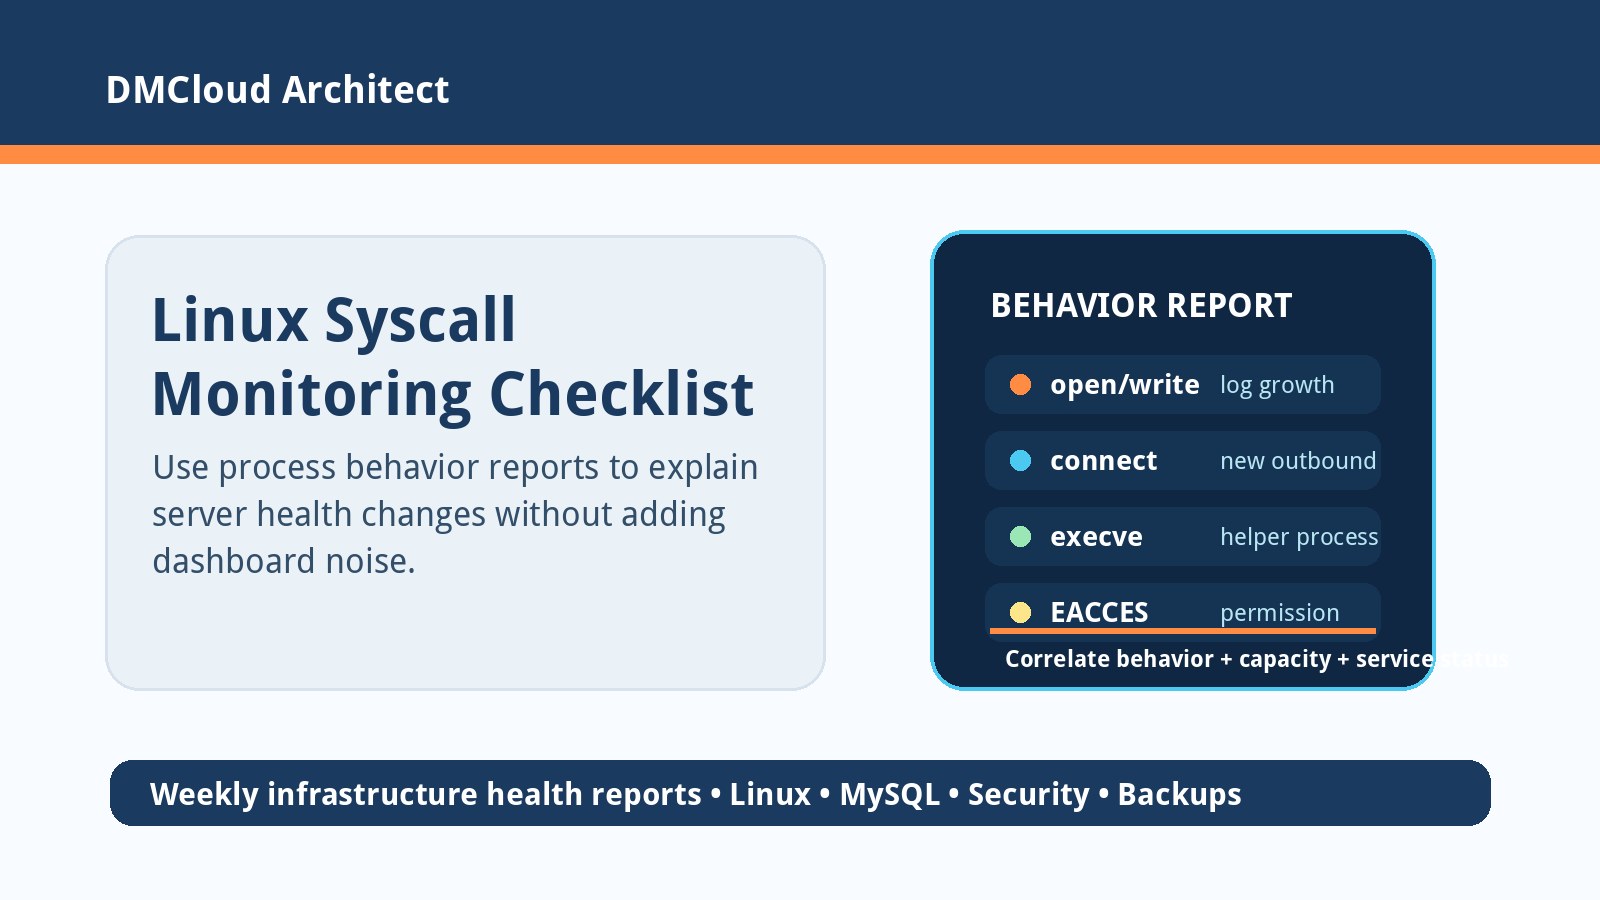
Many small teams delay monitoring because the tooling feels like a project by itself. A lightweight Linux monitoring setup can begin with built-in commands, a scheduled script, and a short report. Tools such as systemd, journalctl, df, free, uptime, ss, mysqladmin, and backup logs already expose much of the information needed for a first pass.
Dedicated Linux monitoring tools can still be valuable, especially when you need graphs, alert routing, and multi-server visibility. The key is to choose tools that reduce decision-making instead of creating another queue of unexplained red badges. A good report should tell you what changed, why it matters, and what action to take next.
Separate emergency alerts from health reporting
Emergency alerts should wake someone up only for immediate user impact or fast-moving risk: a site down, a full disk, database unreachable, certificate expired, or backups failing repeatedly. Health reporting should cover slower issues: disk growth, increasing memory pressure, update backlog, backup age, and database performance trends.
This separation keeps alert fatigue under control. Your team can react quickly when something is truly urgent while still making steady improvements before small risks pile up.
Turn each finding into an owner and a next action
Monitoring is only useful when it changes behavior. Each weekly finding should have a simple next step: rotate logs, increase disk, tune a query, verify backups, patch packages, remove an exposed service, or schedule a capacity review. If a finding repeats for several weeks, promote it from observation to planned work.
For small businesses, this creates a practical bridge between technical health and business continuity. You do not need a large operations team to make better infrastructure decisions; you need a repeatable way to see risk early and act before it becomes customer-facing.
A simple starter routine
- Collect server capacity, failed service, update, backup, certificate, and MySQL health checks once per week.
- Compare the results with the previous report so trends stand out.
- Flag only the items that need action, ownership, or closer observation.
- Reserve urgent alerts for outages and fast-moving failures.
- Review recurring findings monthly and turn them into maintenance tasks.
When this routine is in place, Linux server monitoring becomes less about staring at dashboards and more about making reliable infrastructure decisions on schedule.
Want weekly infrastructure health checks without dashboard fatigue?
DMCloud Architect sends Linux and MySQL infrastructure health reports directly to your inbox, so you can spot risks early without adding another monitoring dashboard to watch.
Get the free starter plan for weekly infrastructure health reports.