A modern VPS management panel can make server operations feel simple: click a button, provision a virtual machine, assign an IP address, open a console, and hand the new server to a customer or project team. That speed is valuable, but it can hide the harder question: does the panel help you operate the server safely after the first boot?
For developers and small business owners, the most useful VPS tooling connects provisioning, access, backups, security, capacity planning, and linux server monitoring into one reliable workflow. This checklist focuses on the operational features that reduce support tickets, prevent avoidable outages, and make growth less chaotic.
Start with the job your VPS panel must perform
Before comparing features, define the panel's real job. Is it mainly for an internal team managing a few customer workloads, a hosting business operating many nodes, or a small business running its own applications? Each use case needs different defaults, but all of them need clarity around ownership, isolation, recovery, and visibility.
A strong panel does not merely create virtual machines. It helps answer everyday operations questions: who owns this VPS, what is it running, how is it accessed, when was it backed up, what changed recently, and which health signal needs attention before users notice a problem?
1. Provisioning should create a documented asset, not just a machine
Fast provisioning is only useful if the resulting server is traceable. Each VPS should have a clear name, owner, plan, operating system, resource allocation, public IP, internal notes, billing or project reference, and creation timestamp. If those details are scattered across tickets, spreadsheets, and memory, troubleshooting becomes slow.
For small teams, the minimum standard is simple: every VPS record should explain why the machine exists and where to find the person responsible for it. That context matters later when disk fills up, a package update is overdue, or an unused test server continues consuming resources.
2. Resource isolation needs visible limits and plain-language status
KVM, containers, and other virtualization approaches can provide strong isolation, but operators still need to see the practical result. The panel should clearly show CPU allocation, RAM, storage, bandwidth expectations, current usage, and whether the server is approaching a limit.
A helpful interface turns raw metrics into decisions. Instead of only showing a CPU graph, it should help you recognize sustained load, memory pressure, storage growth, and noisy-neighbor symptoms. In a customer-facing environment, this visibility also reduces confusion between application problems and infrastructure constraints.
3. Access controls should separate convenience from safety
Browser-based SSH consoles and emergency access features are convenient, especially when a customer or developer is locked out. They also deserve careful controls. The panel should support role-based access, audit logs, limited administrative permissions, and a clear difference between routine login and emergency intervention.
At a minimum, record who opened a console, when access happened, and why it was needed. If the panel integrates with a billing or service desk system, access events should be easy to connect with the related customer, service, or support case.
4. Multi-node management should make placement and capacity obvious
Managing several physical hosts from one interface is powerful, but it introduces placement decisions. A good panel should show which node hosts each VPS, how much capacity remains on every node, and whether planned provisioning would create a weak spot.
Capacity views should include CPU, memory, storage, backup load, network assumptions, and maintenance windows. Without that view, a team can keep provisioning successfully right up until one physical host becomes a hidden concentration risk.
5. Automation needs safe lifecycle states
Provisioning, suspension, reactivation, termination, and billing-system integration should be repeatable and visible. The important detail is state management. When automation fails halfway through, the panel should show whether the VPS is pending, active, suspended, queued for termination, partially created, or in need of operator review.
This is where small operational details matter. Retrying a failed action should not create duplicate resources, skip cleanup, or leave a customer-facing service in an unclear state. A practical VPS panel treats lifecycle automation as a workflow with logs, attempts, and recovery notes.
6. Backups must include restore proof, not just backup creation
Hypervisor-level backups, snapshots, and per-VPS encryption are strong foundations, but the panel should also help prove that backups are usable. Show last successful backup time, backup age, backup size, retention status, encryption status, and recent restore-test evidence.
Database-backed workloads need extra care. If the platform prepares the filesystem before snapshots, make that behavior visible in logs or backup metadata so operators know whether application-consistent backups are expected. The practical question is not "did a backup job run?" but "could we restore this service when it matters?"
7. Linux server monitoring should include trends, not only live graphs
Real-time charts are useful during incidents, but long-term trends are better for preventing them. A VPS management panel should capture load averages, memory pressure, disk usage, inode usage, network changes, service status, patching state, and backup status over time.
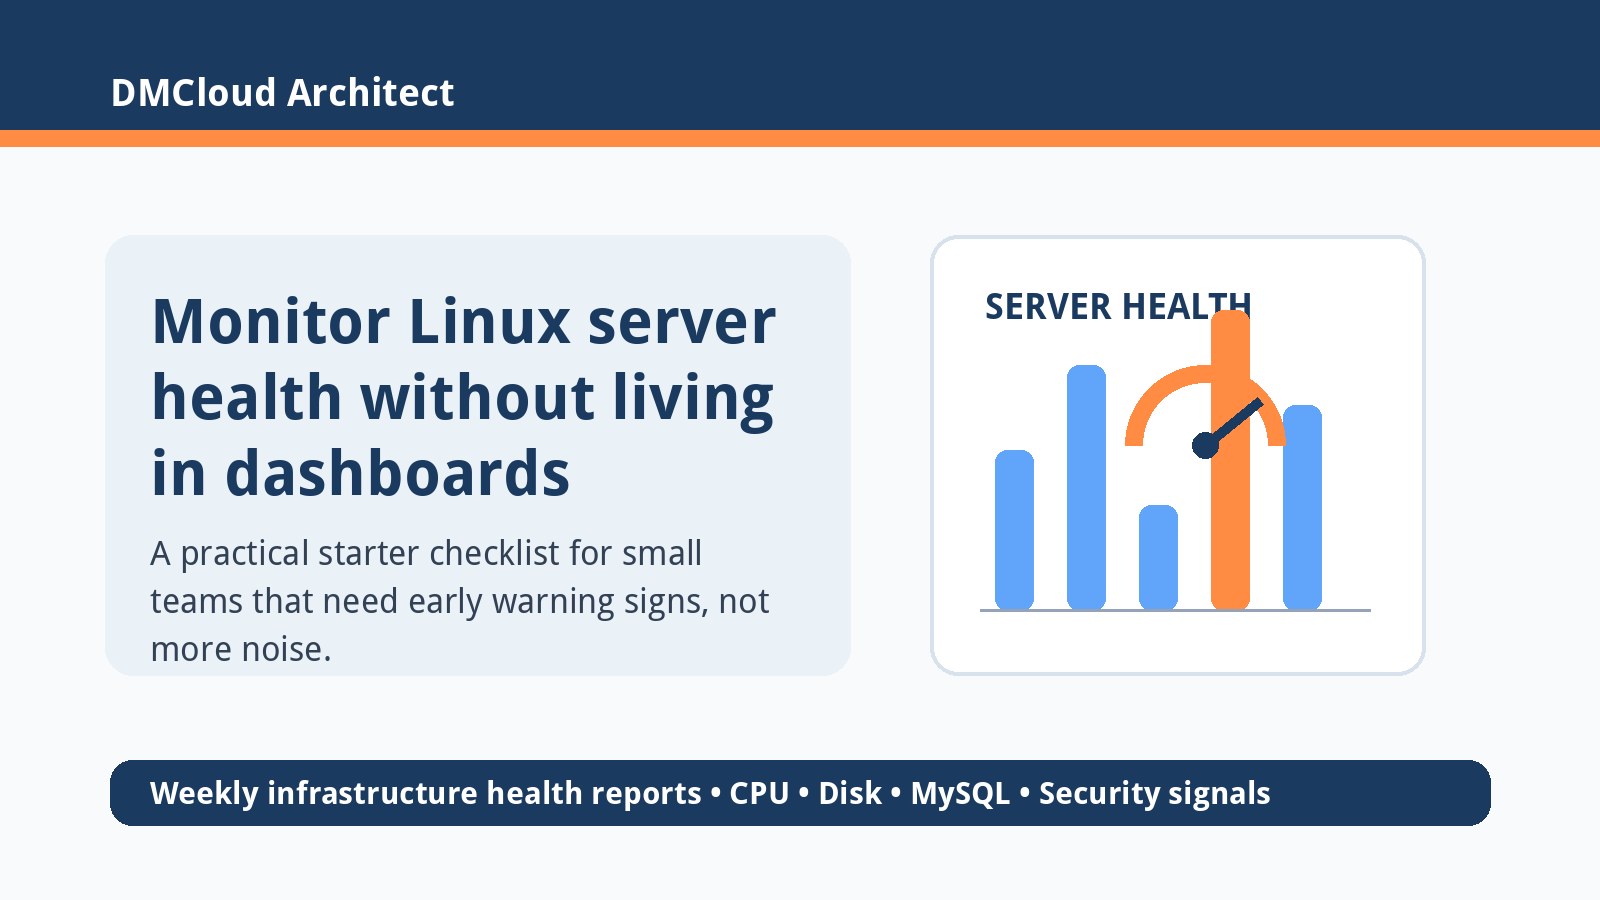
For linux server monitoring, the highest-value view is often a weekly summary: what changed, what crossed a threshold, what grew faster than expected, and what needs action next. That pattern helps small business owners and developers avoid dashboard fatigue while still catching risk early.
8. Security status should be operational, not decorative
Security checklists are only helpful when they connect to evidence. The panel should make it easy to review open ports, firewall status, SSH exposure, privileged users, failed login patterns, pending updates, backup encryption, and recent administrative actions.
Do not rely on a generic "secure" badge. Operators need to know what was checked, when it was checked, and what changed since the previous review. If a hardening action can lock someone out, the interface should encourage verification and rollback planning.
9. Incident evidence should be easy to collect
When a VPS is slow or unreachable, the panel should help collect basic evidence before people start guessing. Useful incident fields include node status, VPS power state, recent lifecycle actions, current resource pressure, disk fullness, console availability, backup freshness, and recent alerts.
For small teams, a simple downloadable health report can be more valuable than a complex observability stack. The goal is to capture enough context to decide whether the issue belongs to infrastructure, the operating system, the application, the database, or an access-control change.
10. Customer-facing features should reduce support friction
If customers can start, stop, reboot, reinstall, open a console, request backups, or view resource usage, the panel should explain those actions clearly. Good self-service reduces tickets only when users understand what each action does and when they should ask for help.
Use plain labels, confirmation prompts for destructive actions, and visible timestamps for recent operations. A customer who can see that a backup completed last night or that disk usage has been climbing for three weeks is more likely to make a good decision before a crisis.
A practical VPS panel health checklist
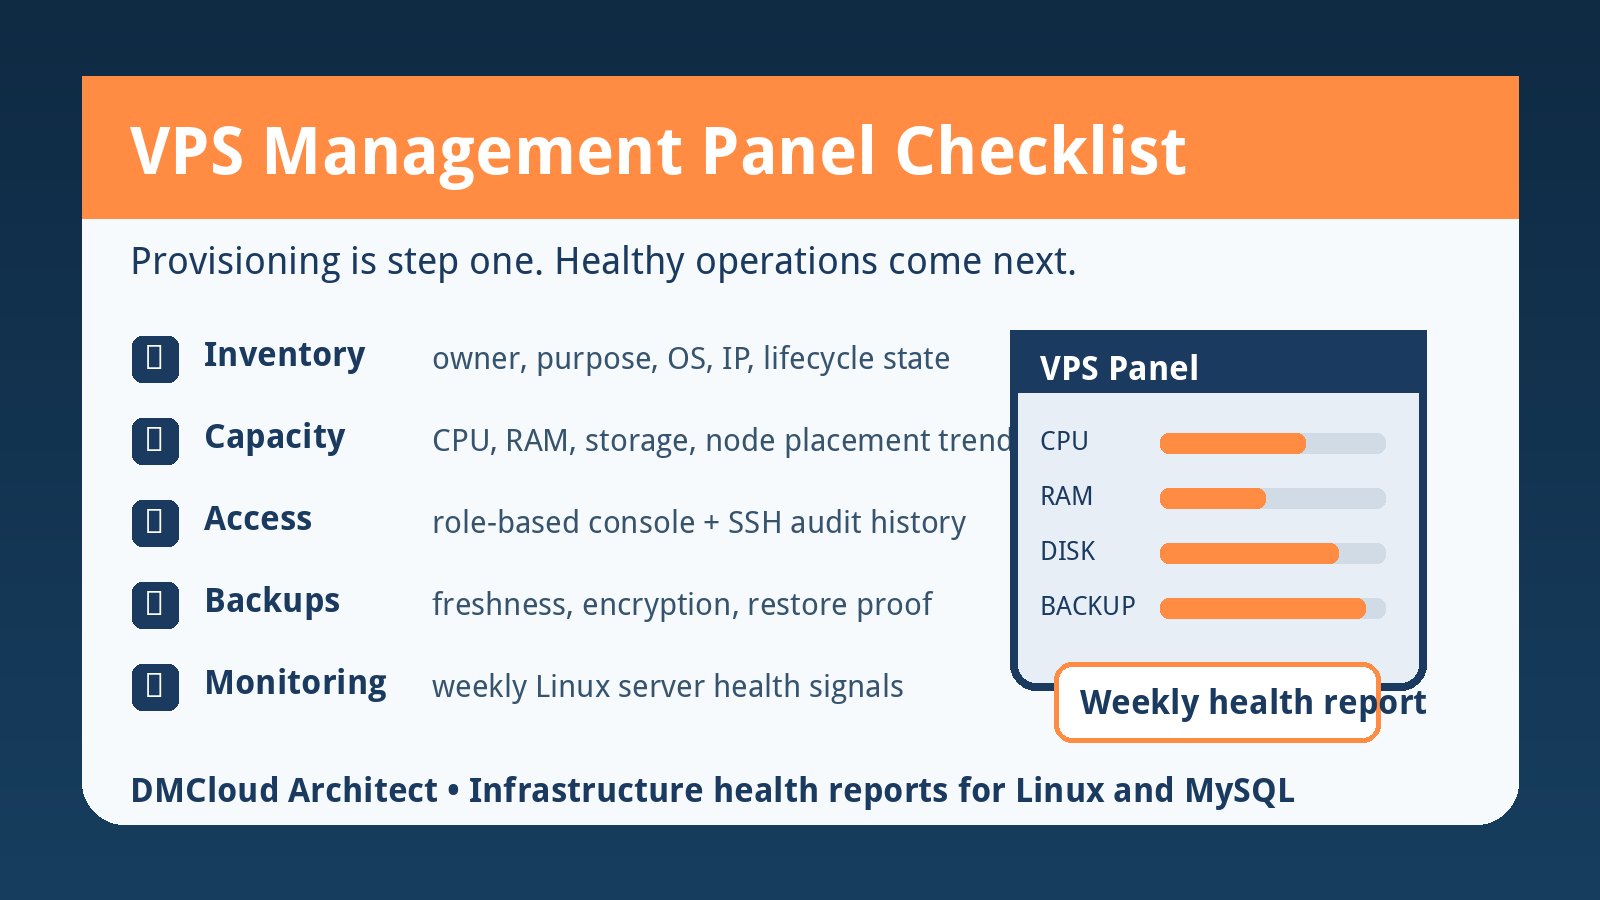
- Every VPS has an owner, purpose, plan, operating system, IP address, and current lifecycle state.
- CPU, RAM, storage, bandwidth assumptions, node placement, and capacity trends are visible.
- Console and SSH access are controlled by roles and logged for review.
- Automation actions have retry-safe states, attempt history, and human-review paths.
- Backups show last success time, age, retention, encryption status, and restore-test evidence.
- Monitoring covers load, memory, disk, inodes, services, updates, networking, and backups over time.
- Security views include open ports, firewall posture, privileged access, failed logins, and patch status.
- Operators can export or review a concise health report during incidents.
What small businesses should prioritize first
If you are not building a hosting platform, you may not need a custom VPS panel. You still need the same operating discipline: asset inventory, access control, backup proof, security review, capacity trends, and a clear health report. Start with those basics before investing in more automation.
If you are evaluating a provider or building internal tooling, ask whether the platform helps you make decisions. A beautiful control panel that cannot show backup freshness, disk growth, update risk, or repeated resource pressure is not enough for production operations.
Turn the panel into a weekly operating rhythm
The best server management workflow ends with a short review. Once a week, collect the top health signals for each important VPS: uptime, load trend, disk trend, patch status, backup status, access changes, open risks, and recommended action. That rhythm gives developers and owners a shared view of what is stable and what needs attention.
Good VPS operations are not about watching every chart all day. They are about noticing the few changes that matter before those changes become outages.
Want weekly infrastructure health checks without dashboard fatigue?
DMCloud Architect sends Linux and MySQL infrastructure health reports directly to your inbox, so you can spot risks early without adding another monitoring dashboard to watch.
Get the free starter plan for weekly infrastructure health reports.