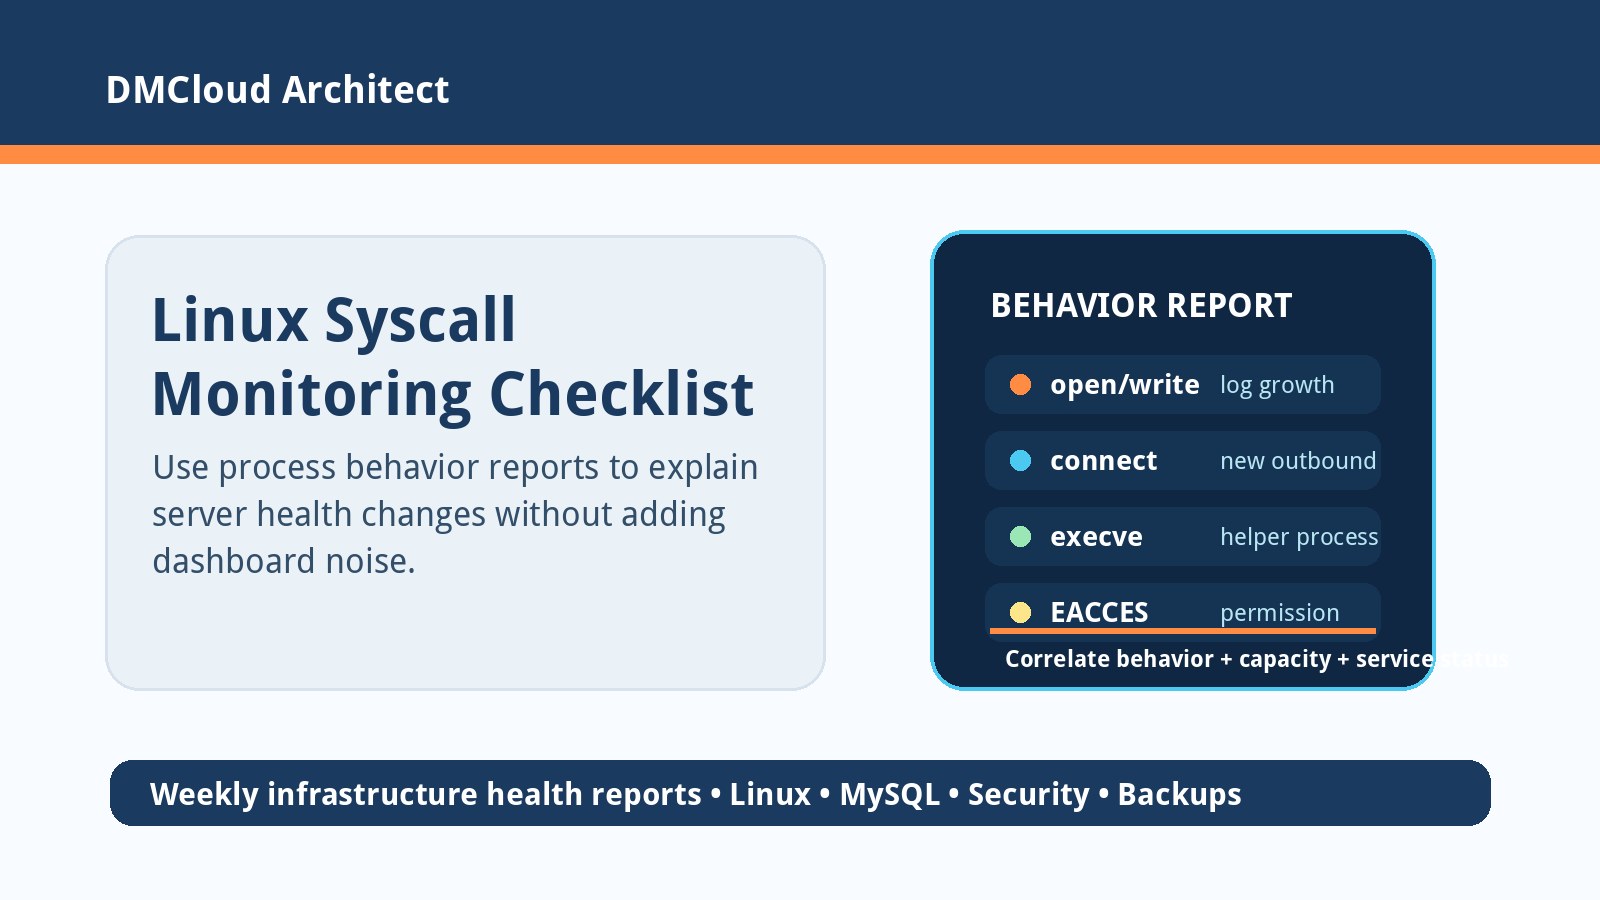
System call tracing can be a powerful way to understand what a Linux process is actually doing. It can reveal file access, network activity, child processes, permission failures, and behavior that normal CPU or memory charts never explain. But for developers and small business owners, syscall visibility is most useful when it supports a broader linux server monitoring routine instead of becoming another stream of raw noise.
This checklist explains how to think about syscall monitoring as part of practical server health. The goal is not to inspect every process forever. The goal is to capture useful evidence when behavior changes, connect that evidence to ordinary health signals, and turn findings into safe operational decisions.
Start with the operational question
Before adding syscall-level tooling, decide what question you need to answer. Are you investigating a slow application, an unexpected outbound connection, a service that keeps failing, a permissions issue, or a process that writes too many files? Clear questions prevent low-level tracing from turning into a fascinating but unbounded debugging project.
A good monitoring report should summarize behavior in language an operator can act on: which process changed, what it attempted, whether the change is expected, and what should be checked next. That translation layer is what makes syscall monitoring useful to small teams that cannot spend hours reading trace output.
1. Use syscall tracing for focused investigations
Tools built around ptrace, eBPF, auditd, or strace-style collection can provide deep process visibility. That depth is valuable during troubleshooting, but it can be expensive or noisy if applied everywhere without a reason. Start with targeted collection around important services, recent deployments, suspicious behavior, or recurring incident patterns.
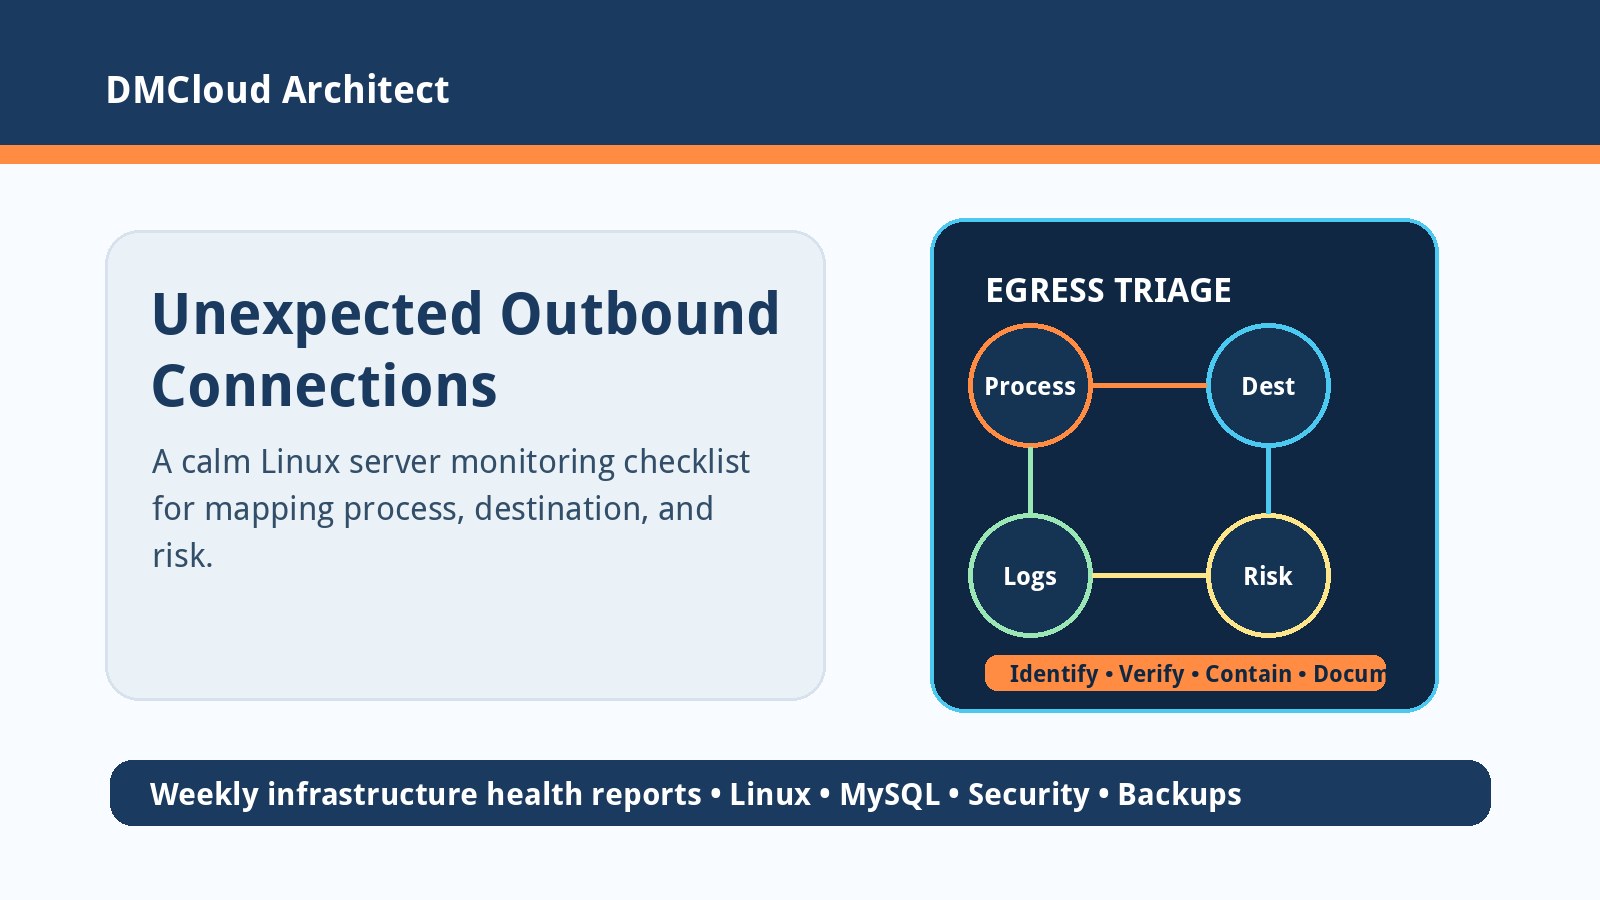
For example, syscall evidence can help explain why a backup job fails, why a web worker cannot write to a directory, why a service is opening unexpected files, or why a process is making network calls that do not match its expected role. Keep the scope narrow enough that the results can be reviewed quickly.
2. Capture context around each behavioral report
A syscall report is much easier to use when it includes operational context. Record the host, service name, process ID or command, collection window, deployment version, user account, container or VM identity, and whether the trace was triggered manually or by an automated rule.
Without that context, a behavior report can look alarming while being completely normal. A package update, backup window, log rotation, health check, or cron task may explain activity that would otherwise look suspicious. Context helps separate real risk from ordinary maintenance.
3. Summarize behavior into safe review categories
Raw syscall lists are difficult to scan. Group observations into categories that map to decisions: file reads and writes, permission denials, process execution, network connections, sockets, signals, and unusual paths. Then highlight only the items that are new, repeated, failed, or outside the service's expected profile.
- File behavior: unexpected writes, rapidly growing logs, sensitive paths, or repeated missing-file errors.
- Process behavior: spawned shells, helper binaries, long child-process chains, or failed exec attempts.
- Network behavior: outbound destinations, listening sockets, repeated connection failures, or unusual ports.
- Permission behavior: denied files, SELinux/AppArmor clues, ownership problems, or privilege assumptions.
- Volume changes: a large jump in open calls, writes, forks, or failed syscalls after a release.
4. Combine syscall findings with normal server health signals
Syscall monitoring should not replace basic infrastructure checks. It should explain them. If disk usage jumps, syscall evidence may show which process is writing and where. If CPU load rises, process behavior may show a loop, repeated failures, or excessive child processes. If a service restart loop appears, syscall errors may point to missing files or permission changes.
This is where linux server monitoring becomes more useful than a single metric dashboard. Capacity, service status, logs, backups, database health, and syscall behavior each answer a different part of the same question: what changed, why does it matter, and what action should happen next?
5. Watch overhead, privacy, and retention
Low-level tracing can expose sensitive information, including file paths, command arguments, environment clues, and access patterns. Treat behavior reports as operational evidence, not public logs. Limit who can view them, redact secrets where possible, and define a retention period that matches your troubleshooting needs.
Also consider overhead. The right collection method depends on the workload, frequency, and depth of detail required. Always test tracing on non-critical workloads first, then apply it carefully to production services with clear collection windows and rollback instructions.
6. Turn reports into maintenance actions
The most useful monitoring output ends with a small next step. A syscall report might lead you to fix file ownership, rotate logs more aggressively, update a service profile, block an unexpected outbound route, document a helper process, tune a backup job, or investigate a deployment that changed behavior.
Avoid turning every interesting observation into an emergency. Label findings as urgent, scheduled, watch, or expected. That keeps the review process calm and helps the team focus on risk rather than novelty.
A practical syscall monitoring checklist
- Define the operational question before collecting low-level traces.
- Trace important services during incidents, deployments, or recurring suspicious behavior.
- Store host, service, user, process, time window, and trigger context with every report.
- Group findings by files, processes, network calls, permission failures, and volume changes.
- Compare behavior against the service's normal role and recent release history.
- Correlate findings with CPU, memory, disk, logs, service status, backups, and database signals.
- Limit access, redact sensitive details, and set a retention policy for behavior reports.
- Convert each meaningful finding into an owner, severity, and next action.
What small teams should implement first
If you do not already have reliable server health reporting, start there. Track uptime, failed services, disk and inode growth, memory pressure, CPU load, update status, backup freshness, certificate dates, database health, and recent security signals. Add syscall-level collection when those basic checks raise a question that ordinary logs cannot answer.
That layered approach keeps monitoring practical. You get early warning from weekly health trends, and you keep deep behavioral tools available for the moments when you need to explain a strange process, a failed service, or an unexpected infrastructure change.
Want weekly Linux server health checks without dashboard fatigue?
DMCloud Architect turns infrastructure signals into plain-language reports so small teams can spot process, capacity, database, and security risks early.
Get the free starter plan for weekly infrastructure health reports.