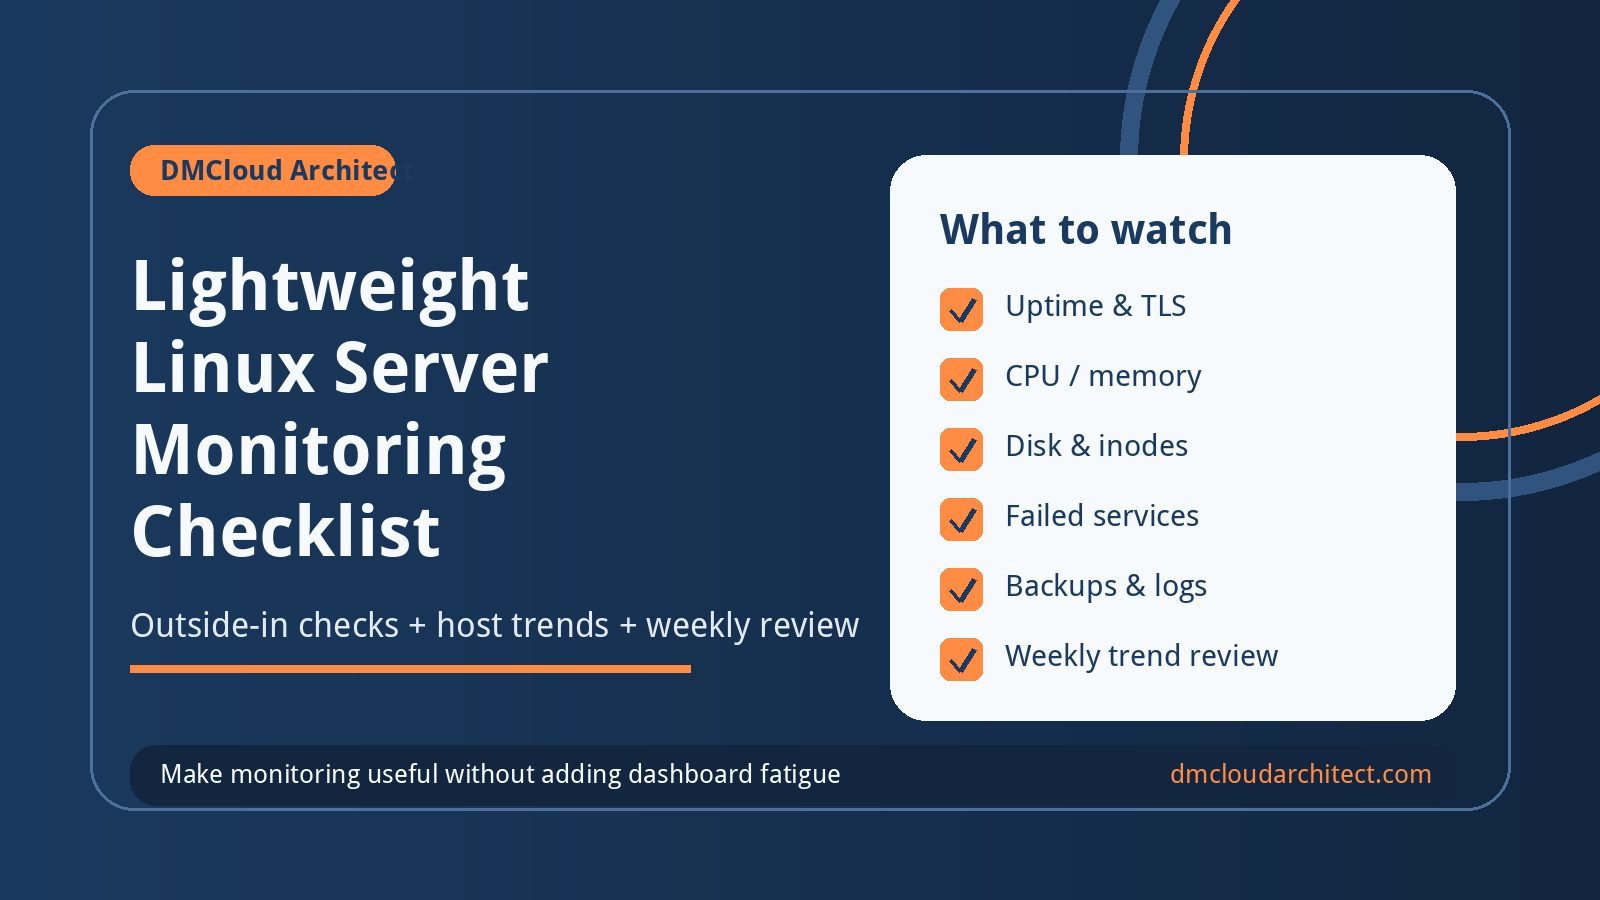
Lightweight monitoring is appealing because small teams do not always need a full observability platform. A simple external checker, a few host metrics, and a repeatable review habit can catch many problems before customers notice them. The risk is assuming that “lightweight” means “uptime only.”
For production Linux servers, linux server monitoring should answer three practical questions: is the service reachable, is the host running out of capacity, and will somebody notice the trend before it becomes an incident? If your tool runs from Cloudflare Workers, a small VPS, a hosted probe, or a cron job, the checklist below keeps the setup useful without making it heavy.
Start with the service promise
Before choosing checks, write down what the server is supposed to provide. A WordPress host, internal API, MySQL box, file server, VPN endpoint, and customer portal all have different failure modes. The monitoring plan should match the business promise, not the tool’s default dashboard.
- Name the important service, URL, port, or process that users depend on.
- Define the acceptable response: HTTP 200, login page loads, TCP port accepts, or a health endpoint returns expected content.
- Record who owns the server and who should be notified first.
- Decide whether the server needs business-hours coverage or true 24/7 alerting.
This keeps the first version focused. A lightweight monitor that checks the wrong thing every minute still misses the real risk.
Use external uptime checks, but make them meaningful
External probes are valuable because they see the server from outside your network. They catch DNS mistakes, firewall changes, expired TLS certificates, routing issues, and application outages that local host metrics may not show. They should do more than ping the box.
- Check the public hostname and the same protocol customers use.
- Verify TLS certificate validity and days until expiration.
- Look for expected page text or health JSON, not just any HTTP response.
- Use more than one region or network path for customer-facing services when practical.
- Set alert thresholds that avoid noise, such as two or three failed checks before paging.
A Cloudflare Workers-style checker can be a good fit for these outside-in tests. Just remember that it proves reachability from the probe location; it does not replace capacity monitoring on the server itself.
Track the host signals that predict tomorrow’s outage
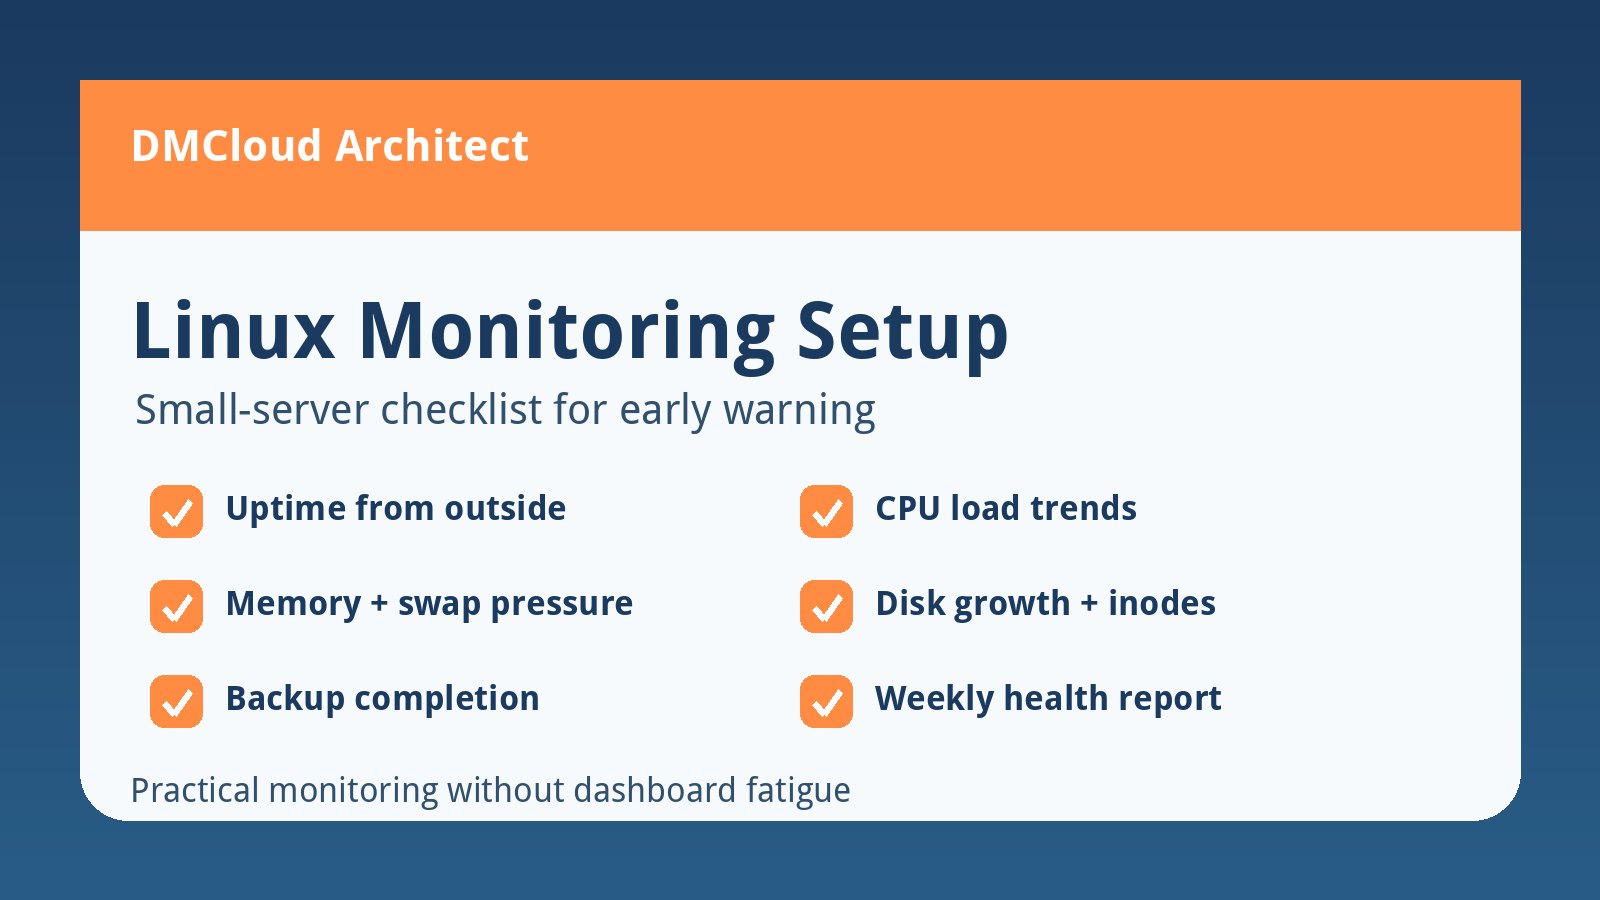
Small production incidents often start as quiet trends. Disk usage grows, swap becomes normal, backups run longer, or CPU load creeps upward after a feature release. These signals are not always urgent at 3:00 AM, but they deserve a weekly review.
- CPU load average and sustained high CPU processes.
- Memory usage, swap activity, and out-of-memory events.
- Filesystem capacity, inode usage, and disk I/O wait.
- Network errors, packet drops, and unexpected bandwidth spikes.
- Reboot history, kernel updates pending, and failed systemd units.
If the monitoring tool cannot collect host metrics directly, pair it with a small local script or weekly infrastructure report. The goal is not to graph everything forever; it is to catch predictable capacity and maintenance problems early.
Add application checks only where they reduce risk
Application-level checks should be selective. Too many custom checks create maintenance work, but the right few tell you whether the business function is alive. Start with the paths that customers or staff would immediately complain about.
- For web apps, check a lightweight health endpoint and one public page with expected content.
- For MySQL-backed apps, monitor database connectivity and slow-query growth.
- For queue workers, check that jobs are being processed and retry counts are not climbing.
- For email or file workflows, verify that a recent successful run exists.
- For backups, alert on missing or failed backup completion rather than only on disk space.
These checks are most useful when they map to an action. If nobody knows what to do when a check fails, document the first response before adding more alerts.
Keep alerts boring and actionable
Alert fatigue is the fastest way to make monitoring useless. Small teams should start with fewer alerts, clear ownership, and a short runbook for each notification. Every alert should say what happened, why it matters, and what to check first.
- Send urgent alerts only for customer-impacting outage signals or fast-moving capacity risk.
- Send weekly summaries for slower trends like disk growth, patch drift, and recurring warnings.
- Include the server name, service, last successful check, and likely next step.
- Review noisy alerts monthly and either tune, downgrade, or delete them.
- Test the notification path before relying on it during a real incident.
A lightweight system succeeds when the team trusts the alerts. Trust comes from accuracy and follow-through, not from the number of graphs available.
Do a weekly health review
Daily alerting tells you when something breaks. Weekly review tells you what is likely to break next. This is especially important for small businesses where one Linux server may carry a website, database, background jobs, and backups.
- Review uptime incidents and whether the alert path worked.
- Check disk, memory, CPU, and backup trends against safe thresholds.
- Look for repeated warnings in logs, failed services, and unusual reboots.
- Confirm certificate, domain, and package-update status.
- Create one small action item for the highest-risk trend.
This review is where linux server monitoring becomes a management habit instead of a tool installation project.
Lightweight monitoring checklist
- Define the service promise and owner for each production server.
- Monitor the public URL, port, TLS certificate, and expected response content.
- Track CPU, memory, disk capacity, inode usage, I/O wait, network errors, and failed services.
- Add only the application checks that map to real customer or staff workflows.
- Use retry thresholds so one temporary probe failure does not create noise.
- Separate urgent outage alerts from slower weekly trend reporting.
- Document the first troubleshooting step for every alert.
- Review trends weekly and assign one preventive action when risk is growing.
Bottom line
Lightweight monitoring is not about doing the least possible. It is about collecting the smallest set of checks that gives your team confidence: reachable service, healthy host, visible trends, and clear next actions. Whether the probe runs on Cloudflare Workers or another simple platform, the checklist matters more than the runtime.
Want weekly infrastructure health checks without dashboard fatigue?
DMCloud Architect sends Linux and MySQL infrastructure health reports directly to your inbox, so you can spot risks early without adding another monitoring dashboard to watch.
Get the free starter plan for weekly infrastructure health reports.