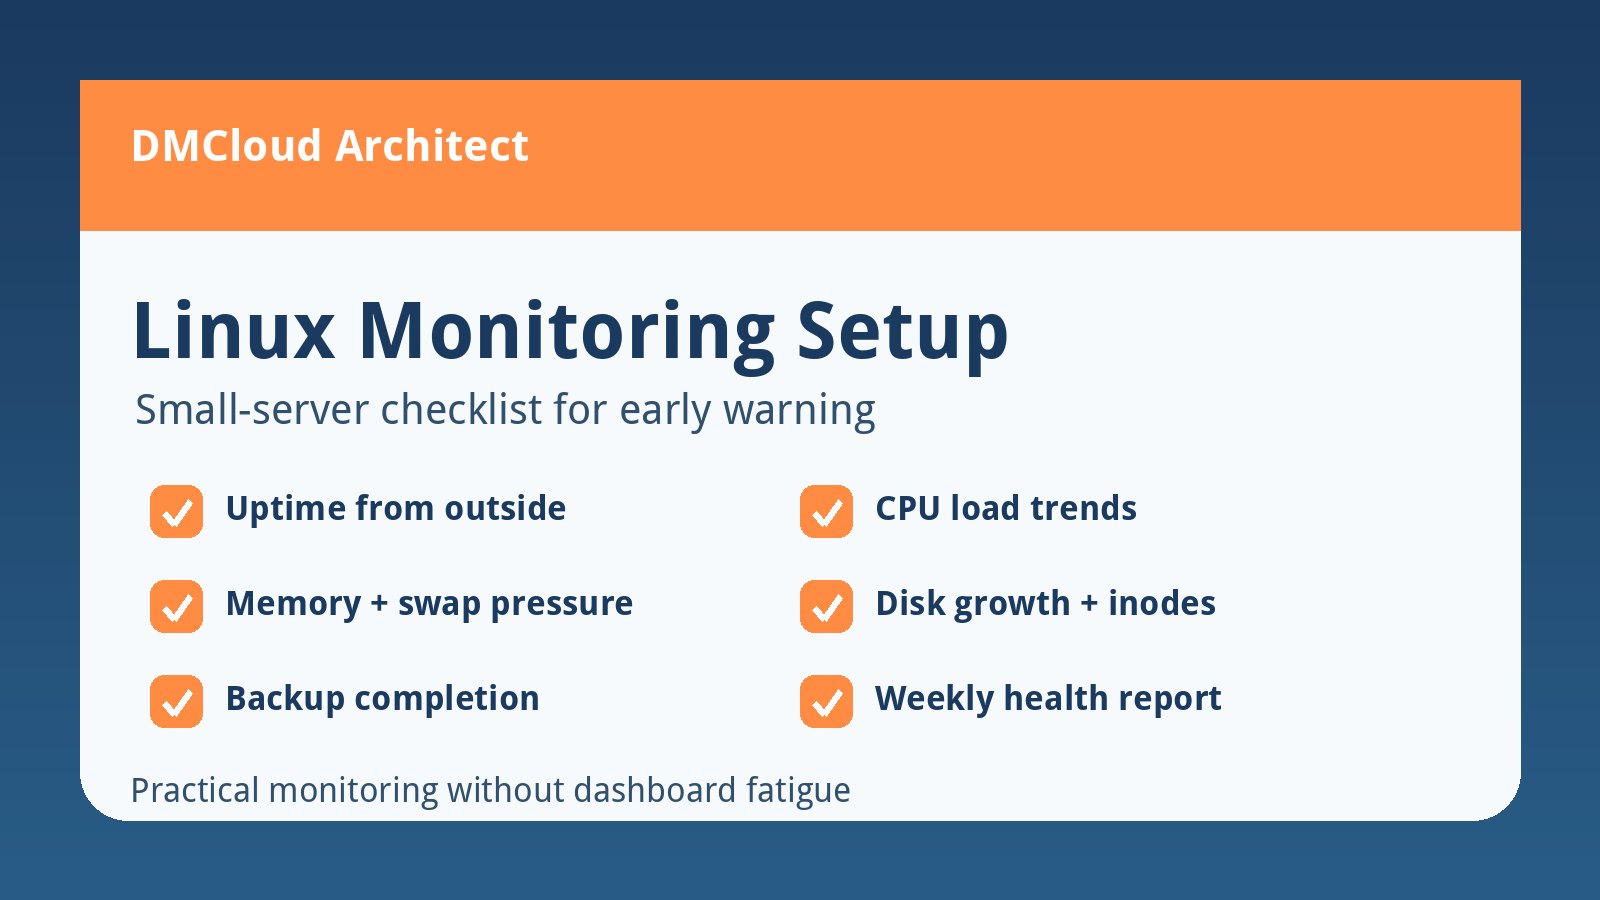
A small Linux server can run quietly for months and still drift toward trouble. Disk fills a little faster, memory pressure creeps up, a backup job starts taking longer, or a certificate renewal warning gets buried in logs. A practical linux monitoring setup is not about collecting every possible metric; it is about catching the handful of changes that usually become outages.
For developers and small business owners, the best first version is simple, boring, and reviewable. You want checks that explain what changed, alerts that only interrupt you when action is needed, and a weekly rhythm that helps you spot trends before customers notice anything.
Start with the server outcomes you care about
Before choosing linux monitoring tools, write down the promises the server must keep. Common promises include: the website responds, the database has enough disk space, backups completed, CPU is not saturated for long periods, and security updates are not being ignored. These outcomes are easier to manage than a giant list of raw metrics.
For a single production server, begin with five questions:
- Can users reach the site or application?
- Is CPU load staying within the server's normal range?
- Is memory pressure causing swapping, restarts, or slow requests?
- Is disk usage growing at a rate that needs attention?
- Did the latest backup or scheduled maintenance job actually finish?
Check uptime from outside the server
Local checks are useful, but they cannot tell you whether customers can reach the service from the internet. Add one external uptime check for the public website, API, or health endpoint. Keep the interval reasonable, such as every one to five minutes, and make sure the alert includes the failing URL and response code.
If the application has a lightweight health endpoint, include a dependency check that catches the most common failure path. For example, a page that only returns static HTML may stay online while the database-backed part of the app is broken. The goal is not a complicated synthetic test; it is one quick signal that confirms the service path users care about is alive.
Track CPU load as a trend, not just a spike
CPU alarms are noisy when they fire on every short spike. Instead, compare load average and CPU utilization against what is normal for that server. A sustained rise over several days often means traffic grew, a job became heavier, or a background process started behaving badly.
A simple linux server monitoring routine should record average load, peak load, and the processes that are most often responsible. If you only look during an incident, you have no baseline. Weekly trend notes make it much easier to decide whether the server needs tuning, a schedule change, or more capacity.
Watch memory pressure and swap activity
Memory usage alone can be misleading because Linux uses available RAM for cache. The more useful signs are swap activity, repeated out-of-memory events, process restarts, and application latency that appears when memory is tight. Your monitoring should separate healthy cache use from pressure that slows the server down.
For small teams, the practical action is to capture memory used, available memory, swap used, and recent OOM messages. If swap keeps climbing during normal traffic, treat it as an early warning. If it happens only during one nightly job, the fix may be scheduling or limiting that job rather than upgrading the server immediately.
Make disk monitoring hard to ignore
Disk issues are one of the easiest infrastructure problems to prevent and one of the most painful to discover late. Monitor root filesystem usage, database volume usage, inode usage, and the growth rate of logs or uploads. A good alert should tell you both the current percentage and the estimated time before the disk becomes urgent.
Do not wait until disk is at 95 percent. Many small servers need attention earlier because package updates, database maintenance, or temporary files need working room. A simple warning at 75 or 80 percent, plus a critical alert closer to 90 percent, gives you time to clean up safely.
Include backups in the monitoring setup
A server can look healthy while backups have silently stopped. Include backup completion as a first-class signal. The check should confirm that the latest backup exists, finished recently, and is not suspiciously small compared with prior backups.
Even better, add a calendar reminder or weekly health report item for restore testing. You do not need to run a full disaster recovery drill every week, but you should periodically verify that the backup process produces something you can actually restore.
Keep alerts actionable
Every alert should answer three questions: what changed, why it matters, and what to check first. “Disk warning on web-01: /var is 82 percent full and grew 9 GB in seven days” is useful. “Disk high” is not. The more specific the alert, the less likely your team is to ignore it.
For a lightweight linux monitoring setup, route urgent issues to the place you will actually see them, such as email, SMS, Slack, or a ticket queue. Route lower-priority trend information into a weekly report. Not every signal deserves a 2 a.m. interruption.
Review a weekly health snapshot
Daily dashboards are easy to forget when you are busy shipping features. A weekly infrastructure health snapshot is easier to keep. It should summarize uptime, CPU trend, memory pressure, disk growth, backup status, security update posture, and any alerts from the prior week.
This review turns monitoring from a pile of charts into a maintenance habit. It also gives small business owners a clear record of whether their infrastructure is stable, slowly degrading, or ready for a planned upgrade.
A simple first-pass checklist
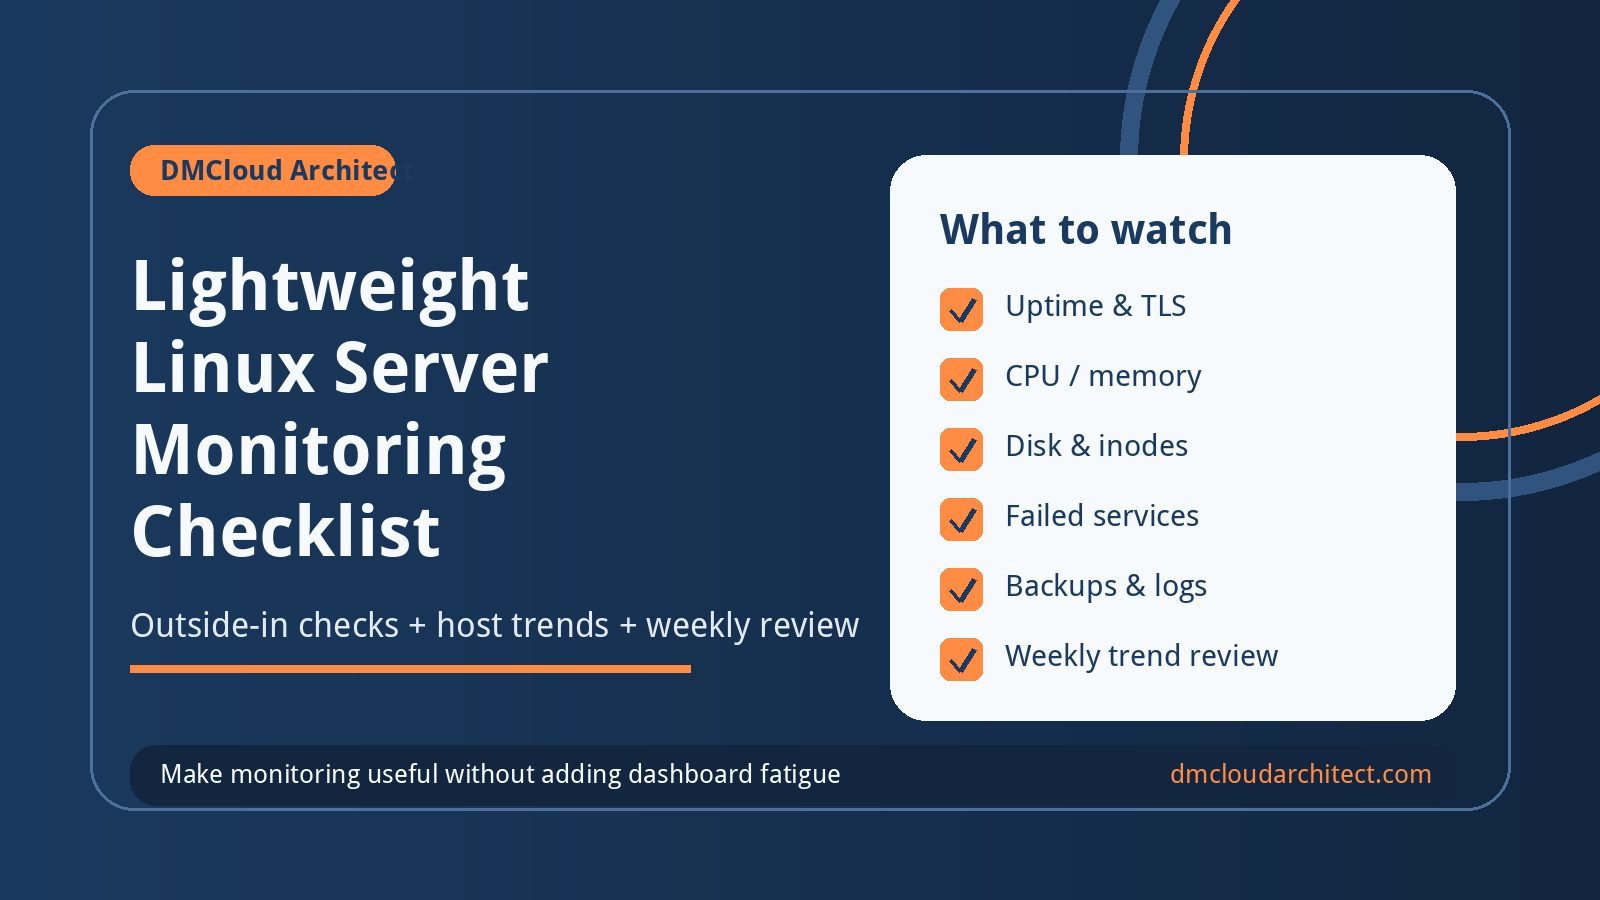
- Add external uptime monitoring for the main service URL.
- Record CPU load and utilization trends weekly.
- Track available memory, swap use, OOM events, and process restarts.
- Monitor disk percentage, inode usage, and disk growth rate.
- Confirm backups completed and occasionally test restores.
- Watch important cron jobs and scheduled maintenance tasks.
- Send urgent alerts only for issues that need fast action.
- Send trend information in a weekly health report.
Build visibility before you need it
The right first monitoring system is the one your team can understand and maintain. Start with the signals that protect uptime, data, and customer trust. Add depth only when a recurring problem proves you need more detail.
A practical linux monitoring setup gives you enough warning to act calmly. That is the real win: fewer surprises, clearer priorities, and maintenance decisions based on evidence instead of panic.
Want weekly infrastructure health checks without dashboard fatigue?
DMCloud Architect sends Linux and MySQL infrastructure health reports directly to your inbox, so you can spot risks early without adding another monitoring dashboard to watch.
Get the free starter plan for weekly infrastructure health reports.