Learning DevOps by memorizing installation commands is frustrating because the commands change, the tools multiply, and AI can now generate a passable setup recipe in seconds. The durable skill is knowing what a healthy system should look like, how to prove it, and what to do when the evidence changes.
That is why linux server monitoring is a strong first project for anyone trying to build real DevOps judgment. It gives you practical topics to learn, useful demos to share, and portfolio evidence that goes beyond "I installed a tool" into "I can operate a server responsibly."
Start with one server and one clear promise
Pick a small Linux server that hosts something simple: a static site, a test API, a WordPress sandbox, a cron job, or a database-backed demo app. Then write one sentence that defines the promise you want the server to keep.
For example: "This server should answer HTTPS requests, have enough disk space for the next month, stay patched, run backups daily, and warn me before users notice a problem." That promise becomes your learning plan.
1. Track uptime and service status
The first monitoring habit is confirming that expected services are running and reachable. Check systemd service state, listening ports, HTTP response codes, TLS certificate status, and whether the application returns a simple health response.
This teaches more than a tool command. You learn the difference between a process that is running, a port that is listening, an endpoint that is reachable, and a user experience that is actually healthy.
2. Watch CPU load without overreacting
CPU monitoring is a good way to practice context. A short spike during a deploy, backup, image resize, or package update may be normal. A sustained load increase at the same traffic level deserves investigation.
Record load average, CPU utilization, top processes, and the time window when the change appeared. The DevOps skill is not simply seeing a red number. It is asking what changed, whether users are affected, and whether the trend is temporary or persistent.
3. Treat memory as a trend, not a single snapshot
Linux memory can look confusing because caching is normal. Instead of panicking over low "free" memory, learn to watch available memory, swap usage, out-of-memory events, and process-level growth over time.
A useful learning project is to chart memory before and after deployments or traffic changes. If one process keeps growing until swap appears, you have a real troubleshooting story to document.
4. Make disk and inode checks non-negotiable
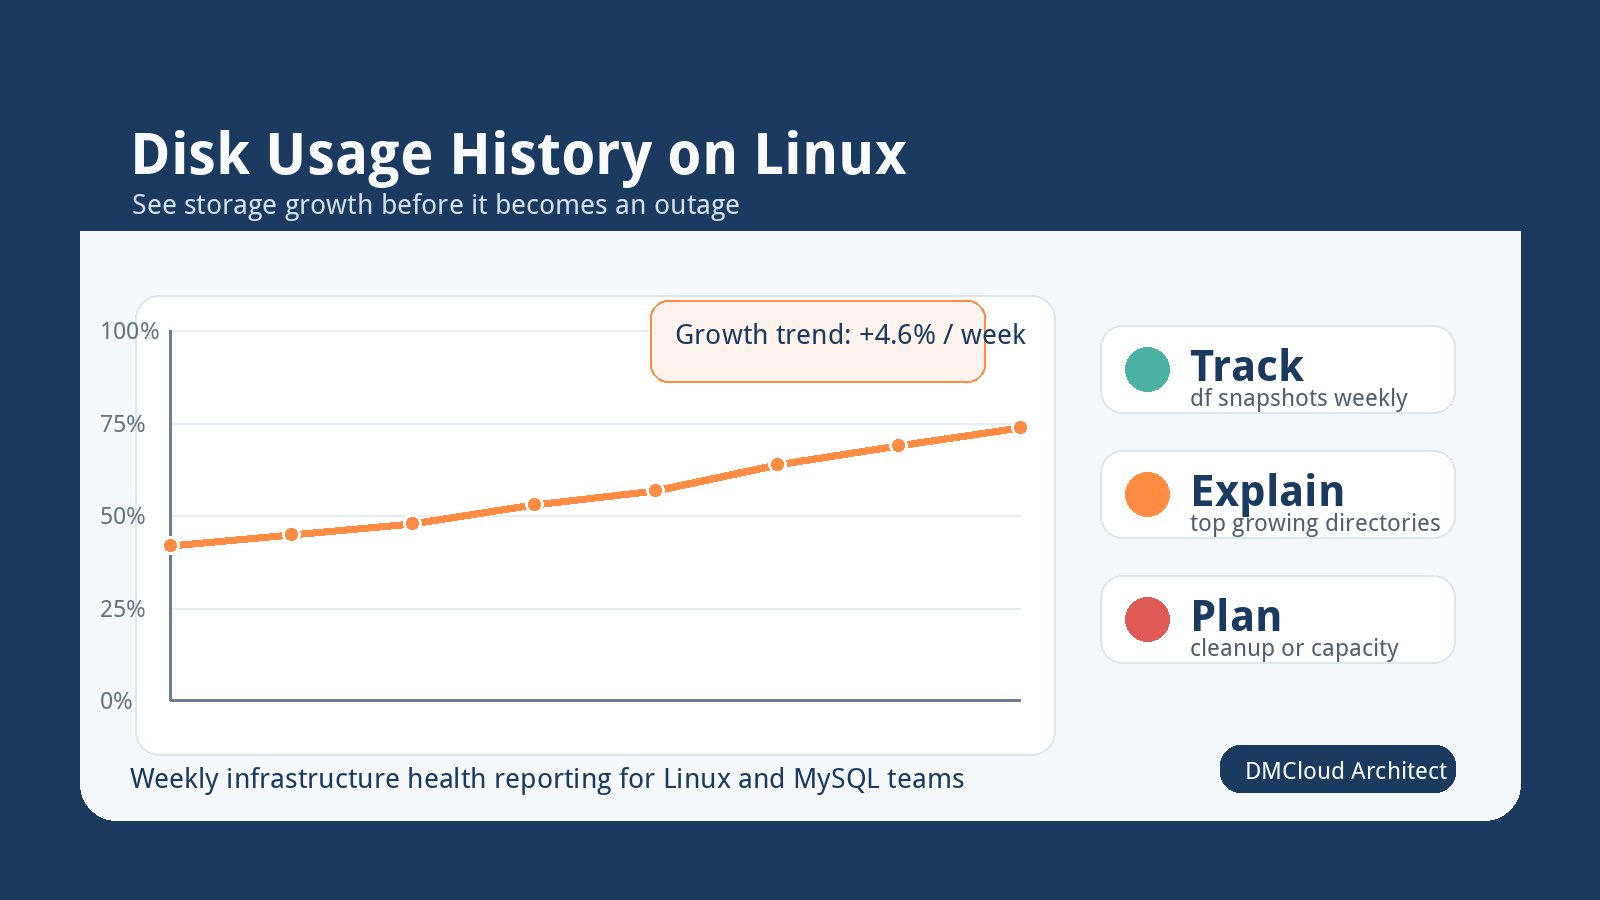
Disk exhaustion causes very practical outages: databases stop writing, logs fail, sessions break, backups cannot complete, and deployments behave strangely. Monitor filesystem usage, inode usage, large directories, database growth, and backup retention.
For a portfolio or teaching project, show the difference between "disk is 82% full" and "at the current growth rate, this volume has about 19 days before it crosses our alert threshold." That second statement is operational thinking.
5. Include patch and reboot visibility
A server can look healthy while silently drifting behind on security updates. Track available updates, security update counts, package manager errors, kernel version, last patch time, and whether a reboot is required.
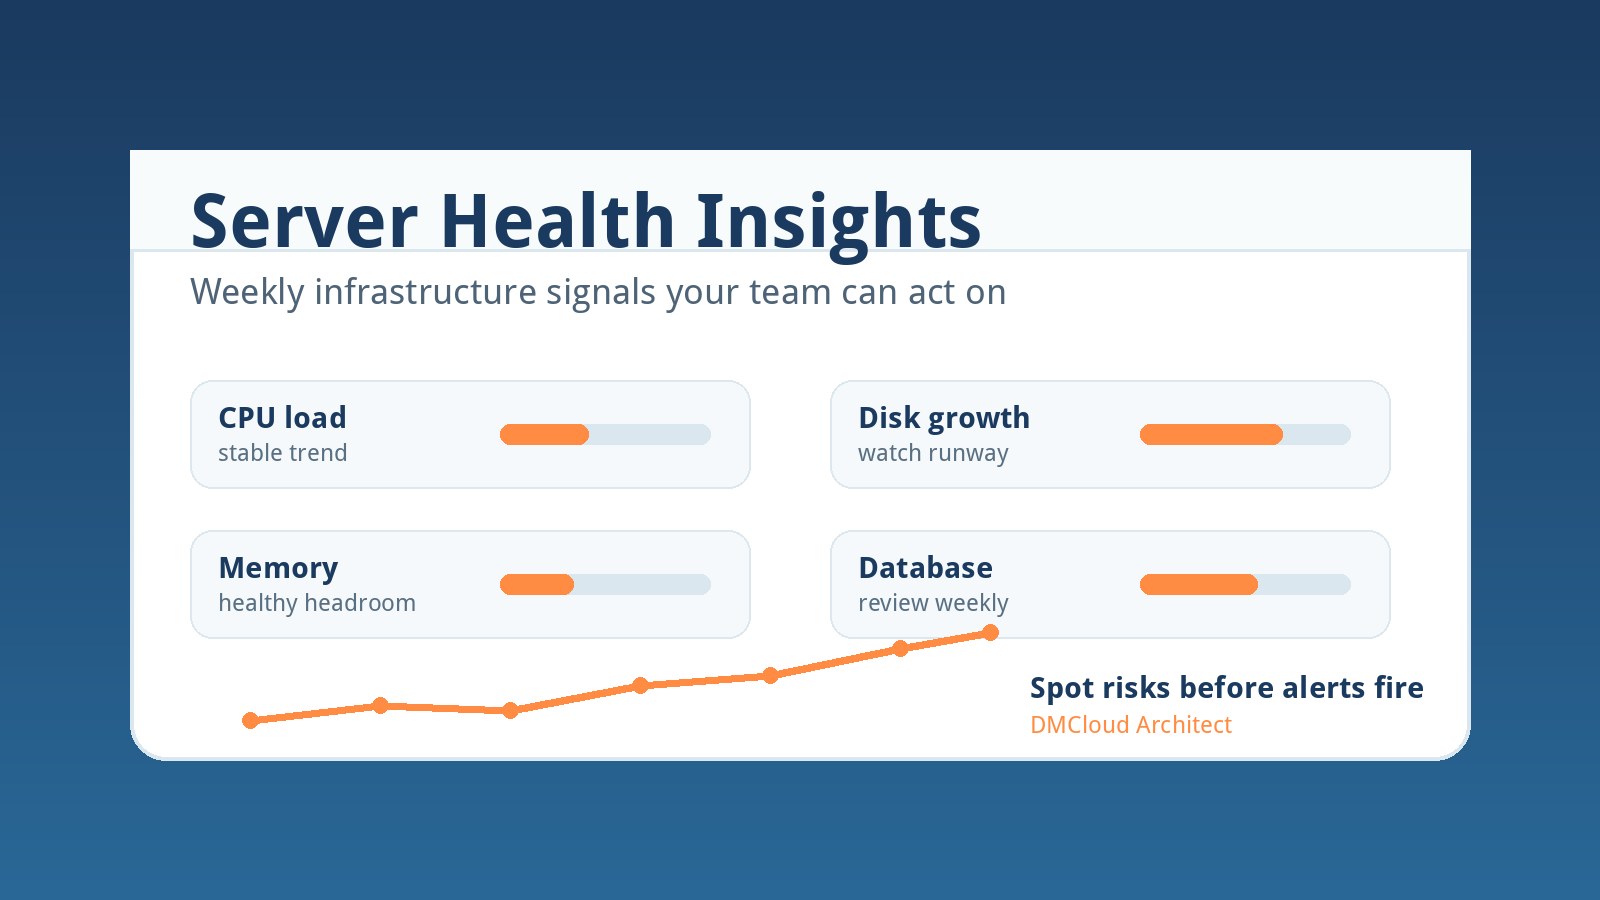
This is especially useful for small business environments where nobody wants to stare at dashboards. A weekly report that says which servers need patch attention can be more actionable than a noisy alert stream.
6. Monitor logs for decisions, not trivia
Logs become overwhelming if you try to read everything. Start with decision-making signals: repeated SSH failures, successful admin logins, sudo activity, service restarts, web 5xx errors, database errors, backup failures, and kernel warnings.
Summarize what changed since the last report. "No new sudo users, two expected deploy restarts, one backup warning" is more useful than dumping hundreds of raw lines into a video, ticket, or email.
7. Verify backups like an operator
Backups are not complete just because a cron job exists. Monitor last successful backup time, backup size, destination, retention, failure messages, and whether a recent backup can be restored into a test location.
This turns a beginner project into a serious operations habit. Small teams often discover backup gaps only during an emergency; your monitoring checklist should surface them during normal work.
8. Tie alerts to runbooks
An alert without a next action creates anxiety. For each signal, define the first response: what to check, what command or dashboard to open, when to escalate, and what "resolved" means.
For example, a disk alert might point to log rotation, backup retention, database growth, and large temporary files. A certificate alert might point to DNS, renewal logs, web server reloads, and expiry date verification.
9. Turn each finding into a teaching asset
If your goal is to learn publicly or build a portfolio, do not compete with AI by making generic "install this package" content. Teach the operational reasoning around a real signal.
Good topics include why a service can be up but unreachable, how disk growth forecasting prevents outages, why patch visibility matters, what backup freshness proves, and how to summarize noisy logs for a business owner. These are problems people still need humans to explain clearly.
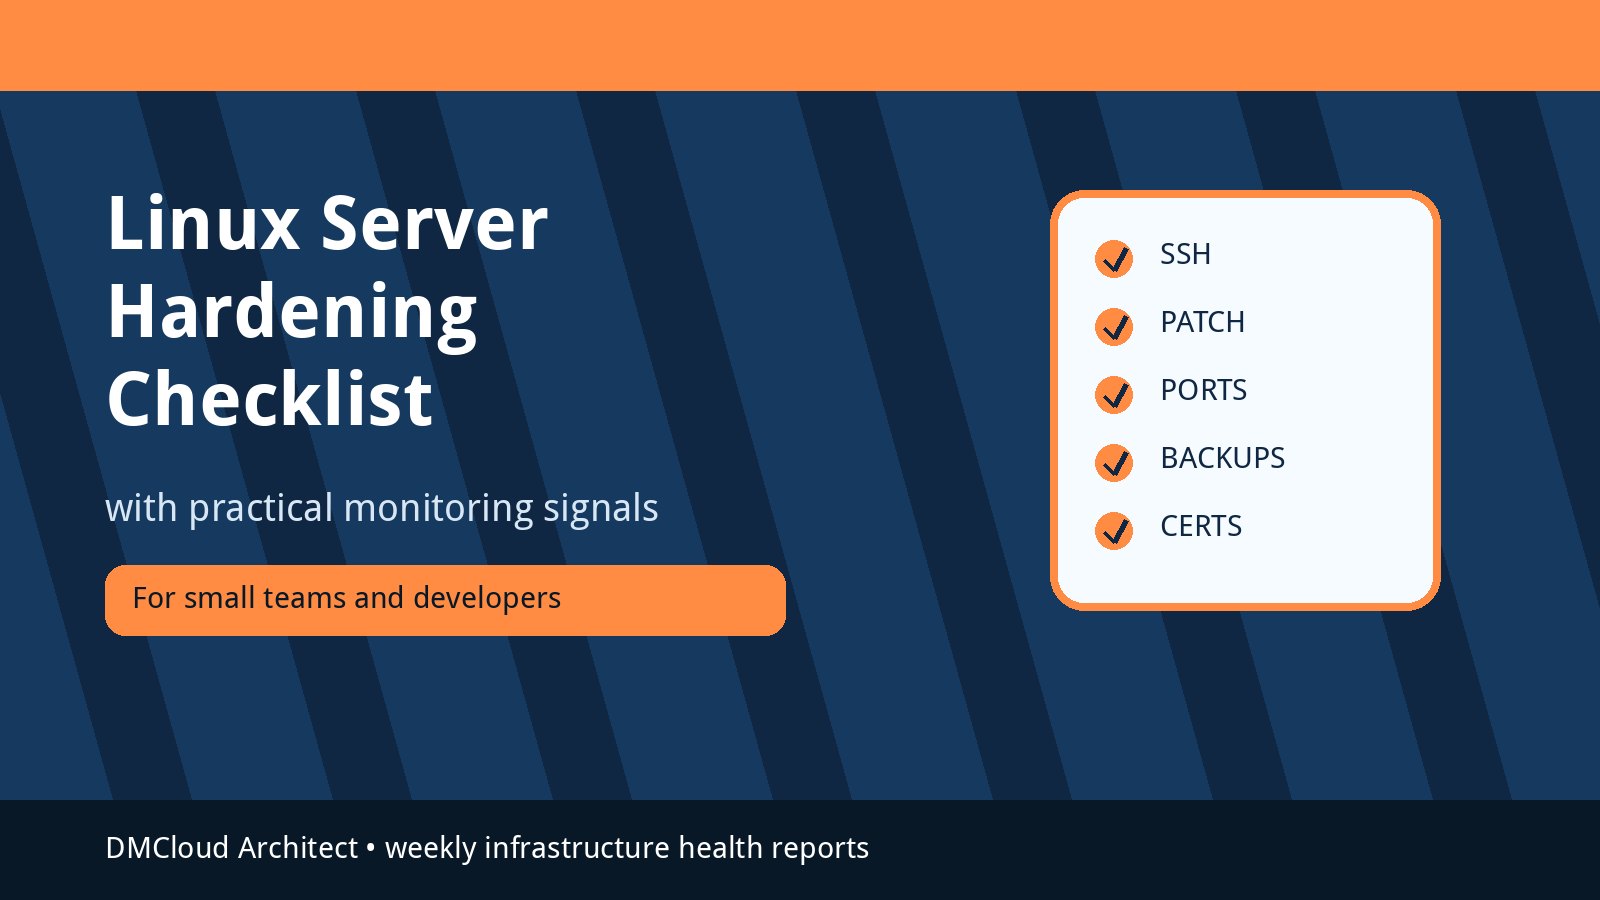
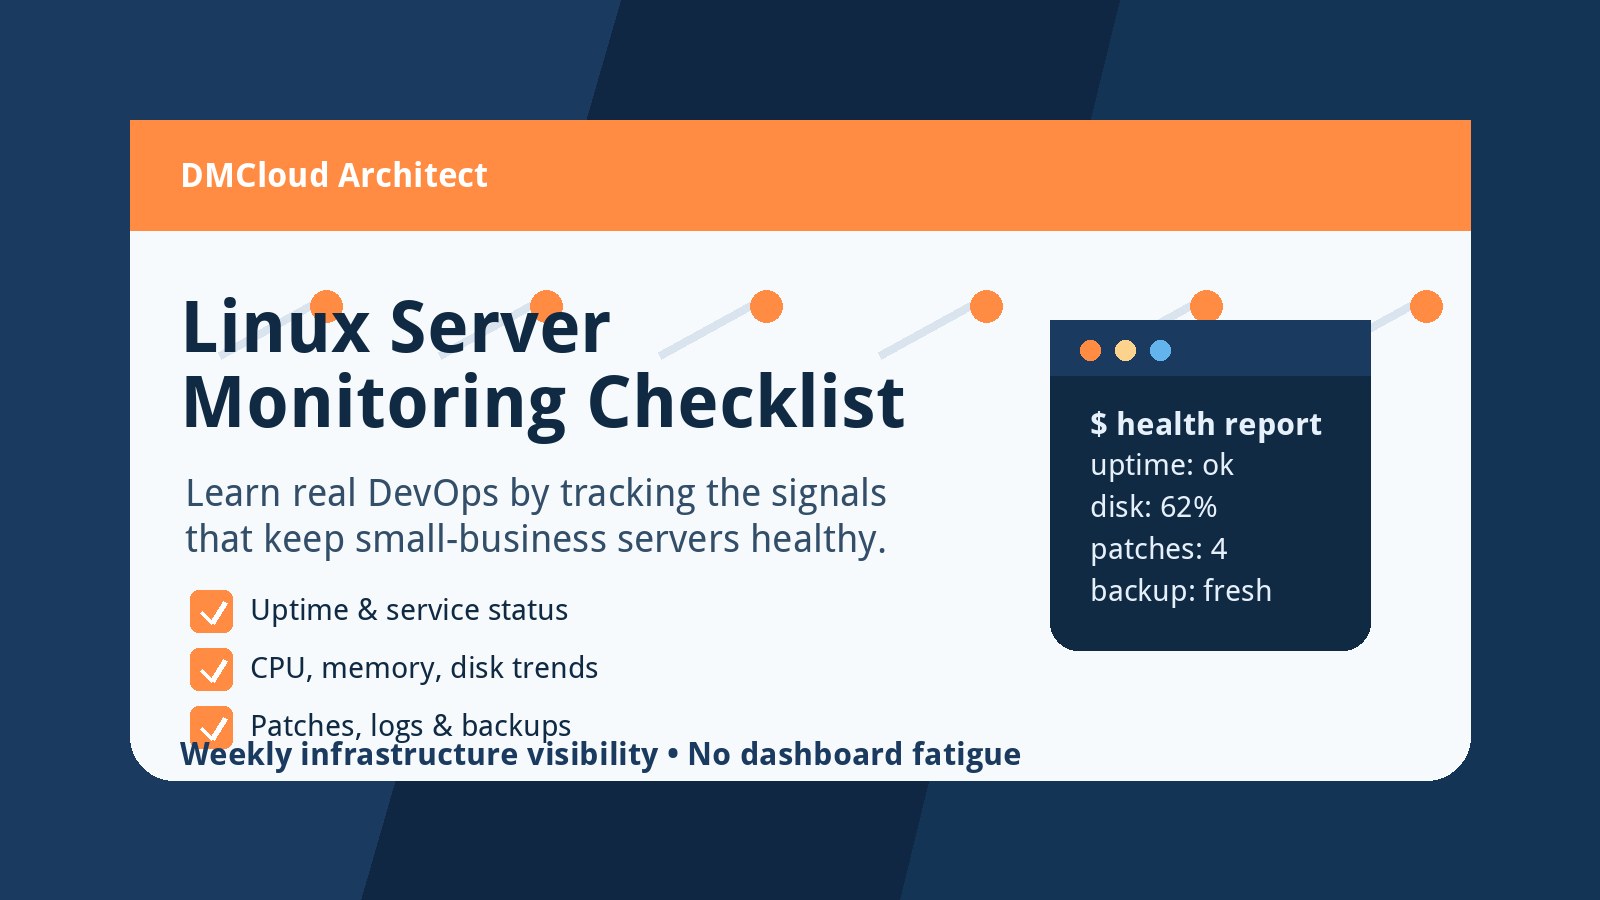
A practical linux server monitoring checklist
- Expected services are running and reachable from the right network path.
- HTTP endpoints return healthy status codes and TLS certificates are valid.
- CPU load is tracked over time with notes for deploys, backups, and traffic changes.
- Available memory, swap usage, and process growth are reviewed as trends.
- Disk and inode usage include growth-rate notes, not just current percentages.
- Security updates, patch age, package errors, and reboot requirements are visible.
- Logs are summarized around authentication, sudo, service, web, database, and kernel signals.
- Backups have last-success time, size, destination, retention, and restore checks.
- Each alert links to a small runbook with first-response steps.
- Reports are saved so tomorrow can highlight drift instead of repeating the same inventory.
A four-week learning path
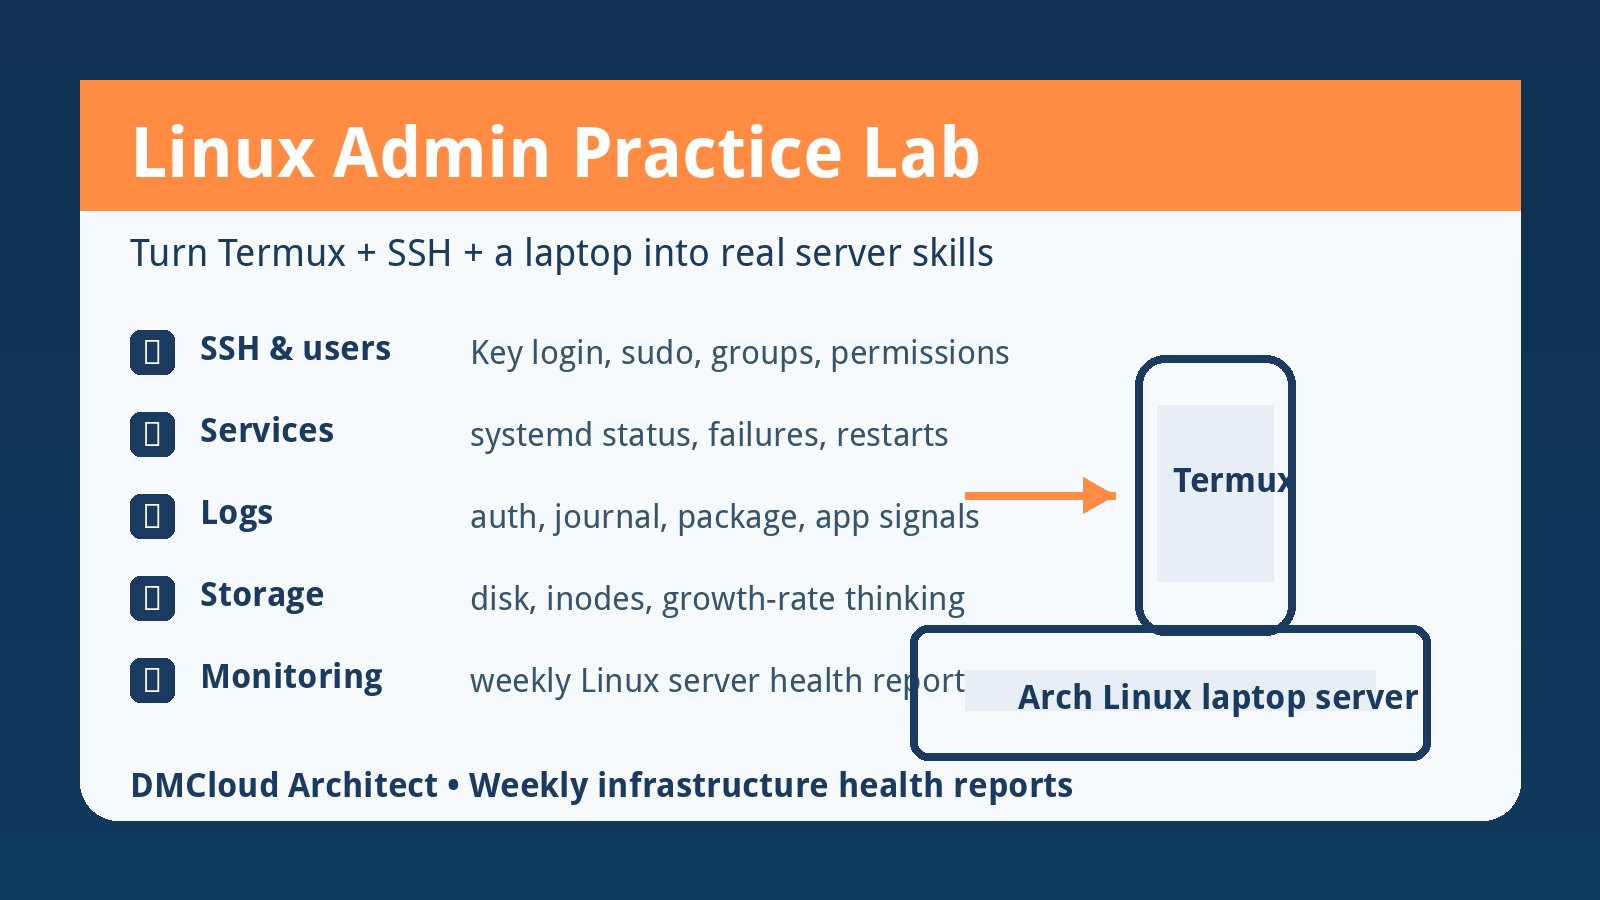
In week one, build a simple server inventory and uptime check. In week two, add CPU, memory, disk, and service status. In week three, add patch visibility, logs, backups, and certificate checks. In week four, turn the output into a short weekly health report with clear recommendations.
By the end, you have something more valuable than a collection of commands. You have a repeatable operating process, screenshots or reports for your portfolio, and enough real context to explain why each signal matters.
What small teams can borrow from this approach
The same checklist works for developers and small business owners who do not want a full monitoring project. Start with one report that answers: is the server reachable, is it running out of capacity, is it patched, are backups working, and did anything important change?
Once those questions are covered, you can add tooling gradually. The discipline matters more than the dashboard: collect the right signals, compare them with the expected baseline, and review them on a consistent schedule.
What to do next
Choose one Linux server and write down its expected services, ports, backup schedule, patch rhythm, and owner. Then create a weekly report that checks those expectations against current evidence.
If the report helps you make one better decision before there is an outage, you are already learning practical DevOps.
Want weekly infrastructure health checks without dashboard fatigue?
DMCloud Architect sends Linux and MySQL infrastructure health reports directly to your inbox, so you can spot risks early without adding another monitoring dashboard to watch.
Get the free starter plan for weekly infrastructure health reports.