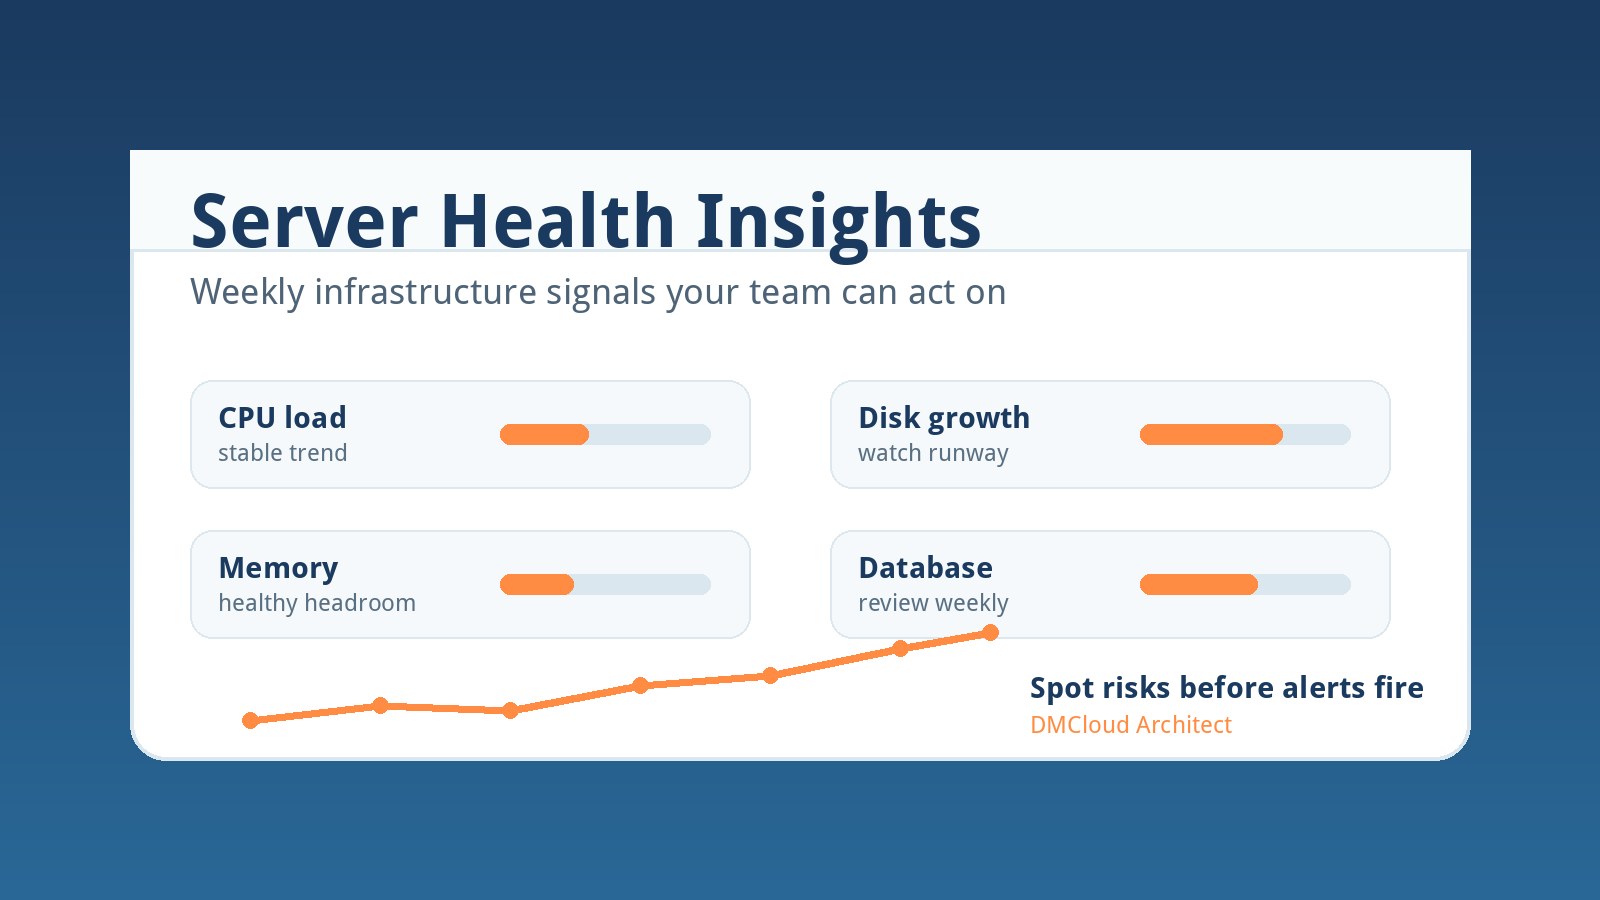
Server health insights are most useful when they explain what changed, not just what number crossed a threshold. A small team can look at CPU load, disk growth, memory pressure, database activity, and backup behavior one item at a time, but incidents usually happen when several small changes add up. A weekly infrastructure health report turns those signals into a short operational story.
For developers and small business owners, the goal is not to build another dashboard that needs daily attention. The practical goal is to collect enough history to know whether a server is stable, drifting toward capacity, or showing early signs of a workload problem. That makes server health reporting a planning tool instead of only an emergency alert.
What good server health insights should answer
A useful report should answer simple questions in plain language. Is the server behaving normally compared with last week? Which resource is changing fastest? Is that change tied to a known release, import, customer onboarding, or backup job? Does anything need maintenance before it becomes urgent?
Those questions matter because a single current metric can be misleading. CPU at 70% may be normal during a scheduled batch job. Disk at 68% may be risky if it was 44% two weeks ago. Memory pressure may be acceptable until database growth and swap activity start moving in the same direction. Server health insights become valuable when they connect the trend with the operational context.
Start with a small set of dependable signals
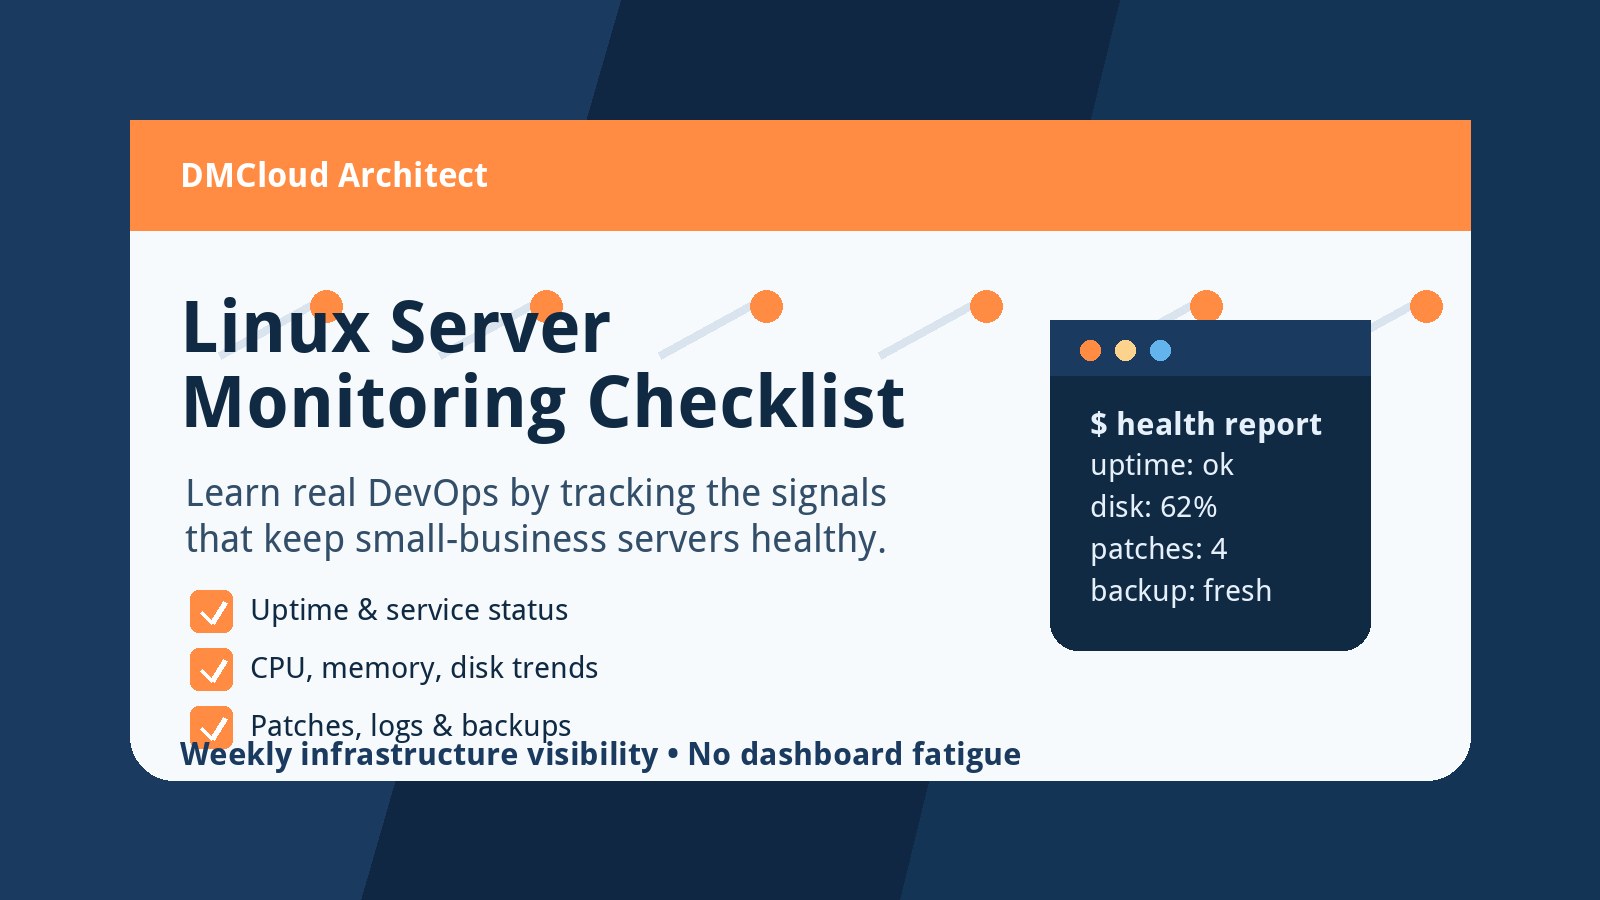
Small teams do not need to collect every possible metric to get value from infrastructure health reporting. Start with signals that explain common incidents and are easy to review consistently:
- CPU load and utilization: show whether workloads are getting heavier or jobs are overlapping.
- Disk usage and growth rate: reveal whether logs, backups, uploads, or databases are consuming capacity faster than expected.
- Memory and swap activity: indicate whether the server has enough working room for normal traffic.
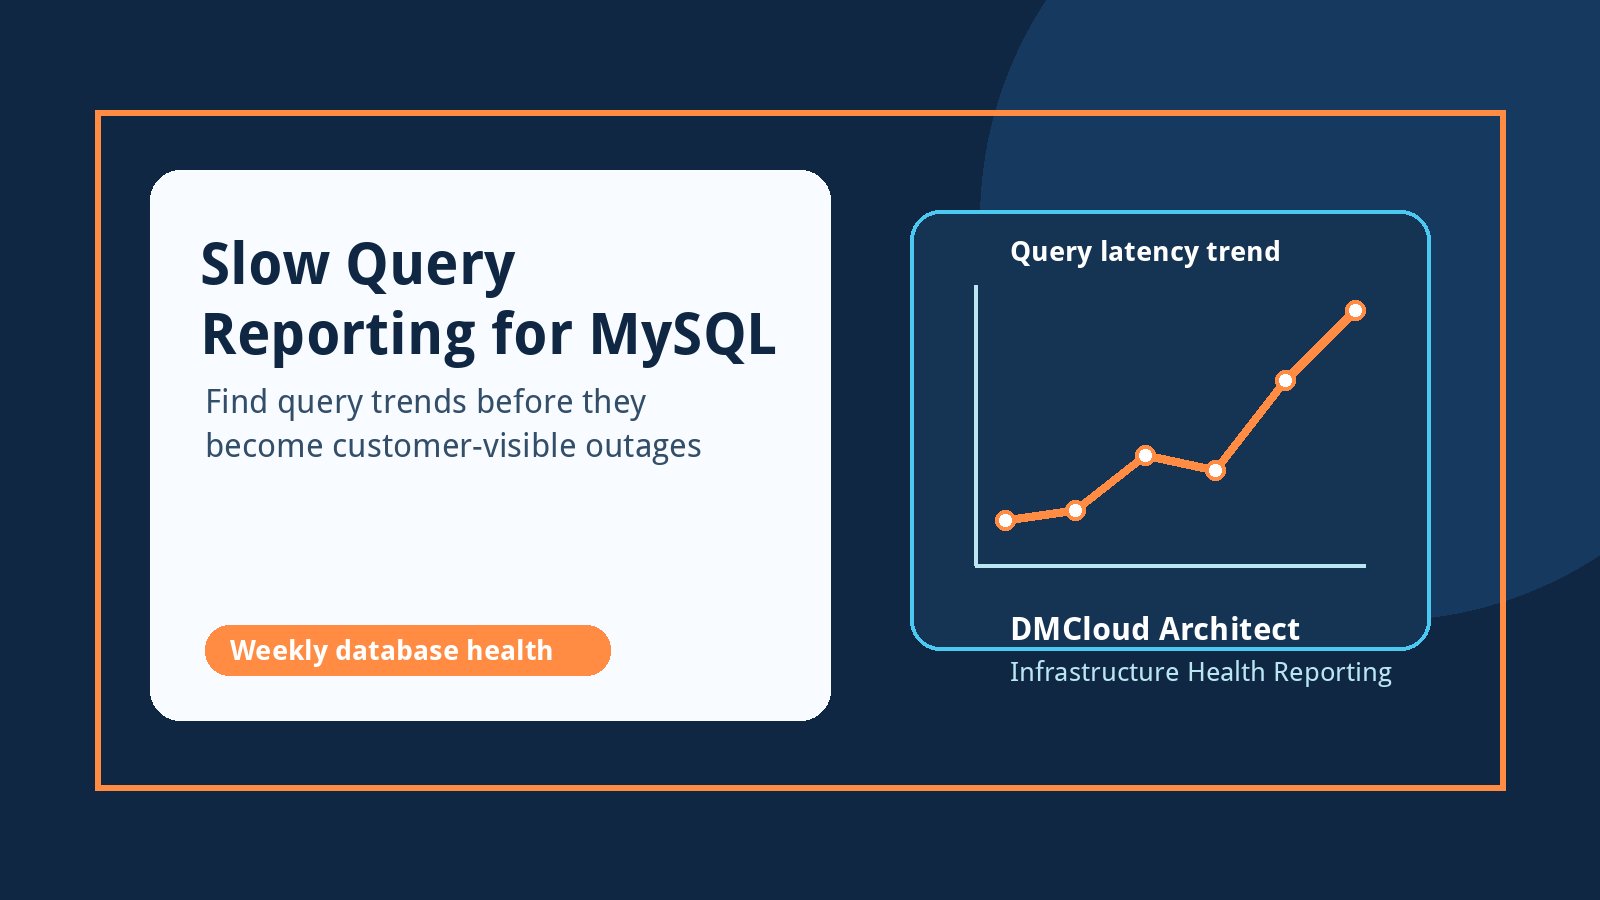
- Database size and query behavior: help explain application slowdowns and growing storage needs.
- Backup and maintenance status: confirm that protective routines are actually completing.
This is enough to create a practical infrastructure monitoring report. You can always add more detail later, but the first win is a repeatable weekly view that makes the most common risks visible.
Look for movement, not just thresholds
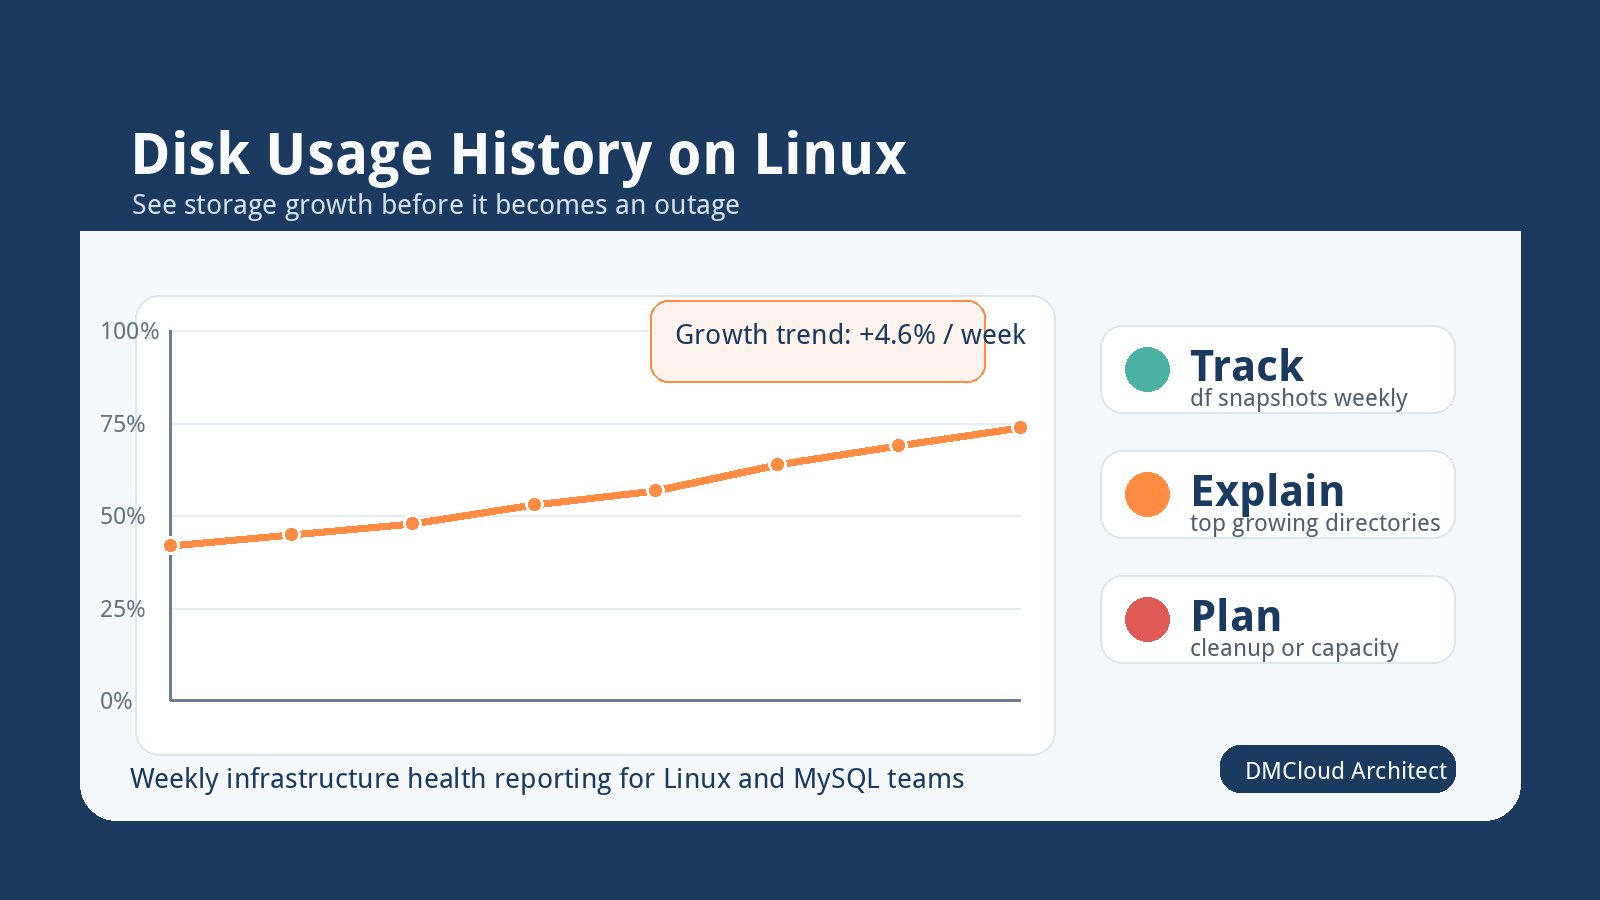
Threshold alerts are important, but they only tell you when something is already near a limit. Trend review tells you whether the limit is approaching. For example, a disk volume at 72% might not trigger an alert today, but if it is growing by 6% each week, the next maintenance window matters.
The same idea applies to CPU and memory. A sustained rise in average load can suggest more traffic, slower queries, a runaway job, or a process that no longer fits the server size. A one-time spike is often less important than a slow upward pattern that repeats every week. Good server health insights call out that movement before the alert fires.
Separate normal change from operational risk
Not every change is a problem. A database may grow because the business is gaining customers. CPU may rise after a new feature starts doing useful work. Backups may take longer because there is more legitimate data to protect. The report should separate expected growth from unexplained risk.
When a metric changes, review it against recent events. Did a release go out? Did a batch import run? Did a retention setting change? Did traffic increase? If the answer is clear and capacity still looks healthy, the item may only need a note. If the answer is unclear or the trend shortens your runway, turn it into maintenance work.
Make the weekly review easy to act on
A server health weekly report should not be a pile of charts. It should make the next action obvious. A useful format is:
- Stable: no meaningful change from the previous reporting period.
- Watch: a resource is trending upward, but there is still enough time to investigate calmly.
- Action needed: cleanup, capacity planning, query review, backup repair, or maintenance should be scheduled.
This structure helps non-specialists make better decisions. A business owner does not need to interpret every graph to know that storage cleanup should be planned. A developer does not need to rediscover the same CPU trend every week. The report preserves context so the team can focus on action.
Examples of insights worth flagging
The best system health reporting highlights observations that lead to decisions. Examples include:
- Disk growth accelerated after a reporting job launched. Review export retention and generated file cleanup.
- Average CPU load increased for three weeks in a row. Check scheduled jobs, slow queries, and release timing.
- Swap activity appeared on a server that previously had none. Review memory usage before application latency gets worse.
- Database storage grew faster than application uploads. Inspect table growth, binary logs, indexes, and backup size.
- Backups completed late or inconsistently. Fix reliability before relying on them during an outage.
Each observation is short, but each gives the team a next step. That is the difference between a metric dump and meaningful server health insights.
A lightweight reporting rhythm
For many small environments, a weekly review is enough. Capture the important metrics, compare them with recent history, and summarize the top changes. Keep the report short enough that someone will actually read it. If an item needs work, convert it into a maintenance task with an owner and a due date.
Daily alerts can still handle urgent failures. Weekly infrastructure health reporting handles the slower risks that alerts often miss: capacity drift, creeping CPU load, database growth, and maintenance routines that quietly stopped working. Together, they give small teams both immediate protection and better planning visibility.
The practical takeaway
Server health insights are not about collecting perfect metrics. They are about noticing patterns early enough to make calm decisions. Start with a simple weekly report, focus on resource movement over time, and explain each meaningful change in plain language. When the report points to a next action, schedule it before the issue becomes an outage.
Want weekly infrastructure health checks without dashboard fatigue?
DMCloud Architect sends Linux and MySQL infrastructure health reports directly to your inbox, so you can spot risks early without adding another monitoring dashboard to watch.
Get the free starter plan for weekly infrastructure health reports.