Back to Blog
How to Plan Disk Growth Before Your Linux Server Runs Out of Space

How to Plan Disk Growth Before Your Linux Server Runs Out of Space

   Mariusz Antonik    Automation    5 min read    7 views

A full disk is one of the most preventable server outages. Logs grow, uploads accumulate, database files expand, backups stack up, and temporary directories quietly become permanent storage. By the time an application starts failing writes or MySQL refuses to start cleanly, the warning signs were probably visible for weeks.

Small teams do not need an enterprise storage platform to stay ahead of this. They need a practical way to plan disk growth server, compare usage over time, and decide when cleanup, resizing, archiving, or architecture changes should happen.

Why disk growth planning matters

Disk monitoring is often treated as a threshold problem: alert when a filesystem reaches 80%, panic at 95%, and clean something up when the pager goes off. That catches emergencies, but it does not answer the planning question: how soon will this server need attention if the current growth rate continues?

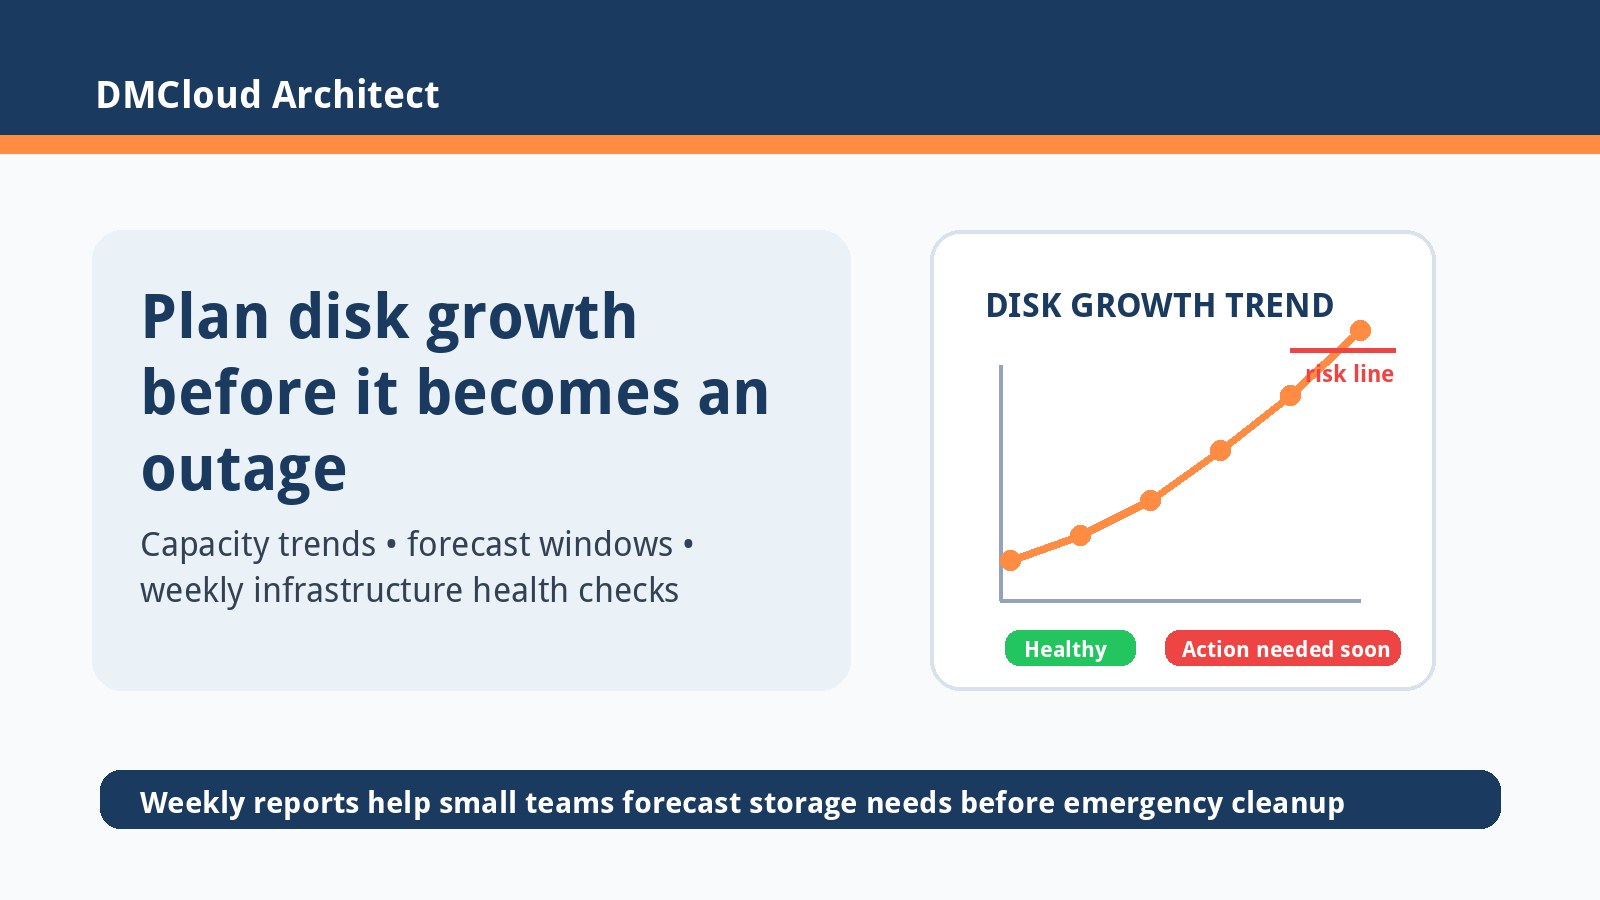
Capacity planning turns disk usage from a surprise into a forecast. If a volume grows by 8 GB per week and has 60 GB free, you can estimate a rough action window. If the same volume only grows during month-end imports, you can plan around business cycles instead of reacting to a generic alert.

Start with the filesystems that affect production

Not every mounted filesystem deserves the same attention. Focus first on the paths that can break user-facing services: application uploads, database storage, log directories, backup staging areas, package caches, and any shared storage used by background jobs.

  • Application data: user uploads, generated reports, exports, media, and documents.
  • Database files: MySQL data directories, binary logs, temporary tables, and backup dumps.
  • Logs and queues: web logs, application logs, failed-job payloads, and retry queues.
  • System storage: package caches, old kernels, temporary files, and unattended backup copies.

Track trend, not just percent used

A server at 72% disk usage may be healthy if it grows slowly and has predictable cleanup. A server at 45% can be risky if a new import job adds hundreds of gigabytes each month. Disk capacity planning for a server should include current free space, weekly or monthly growth rate, known upcoming events, and the time remaining before a practical action threshold.

For a lightweight starting point, record filesystem usage once per week and compare it with the previous report. Include both percentage and absolute free space. Percentages are easy to scan, but absolute free space makes growth forecasts more realistic.

Use simple forecast windows

You do not need perfect predictions. A simple forecast window is enough to guide action:

  1. Measure used space today.
  2. Compare it with the same measurement from one or more previous weeks.
  3. Estimate average weekly growth.
  4. Divide usable free space by that weekly growth rate.
  5. Flag anything that needs action within the next 30, 60, or 90 days.

This gives developers and business owners a shared language. Instead of saying “disk is high,” the report can say “the upload volume is projected to hit the action threshold in about six weeks at the current growth rate.” That is much easier to prioritize.

Watch for inode and file-count pressure

Disk space is not the only storage limit. Linux filesystems can also run out of inodes when many small files accumulate. This often happens with cache directories, session files, mail queues, thumbnails, and job artifacts. A server can show available gigabytes while still failing to create new files.

Include inode usage in your weekly review, especially for directories that generate many small files. If inode usage rises faster than disk usage, cleanup rules may need to target file count and age rather than total bytes.

Plan actions before cleanup becomes risky

Emergency disk cleanup is stressful because every deletion feels dangerous. Planned capacity work gives you safer options: rotate logs, expire old exports, move archives to object storage, resize a volume, adjust MySQL binary log retention, or separate application uploads from database storage.

When a disk forecast crosses your action window, assign an owner and a next step. The goal is not just to notice growth; it is to decide whether the right fix is cleanup, retention policy, storage expansion, or application change.

Build disk growth into your weekly health report

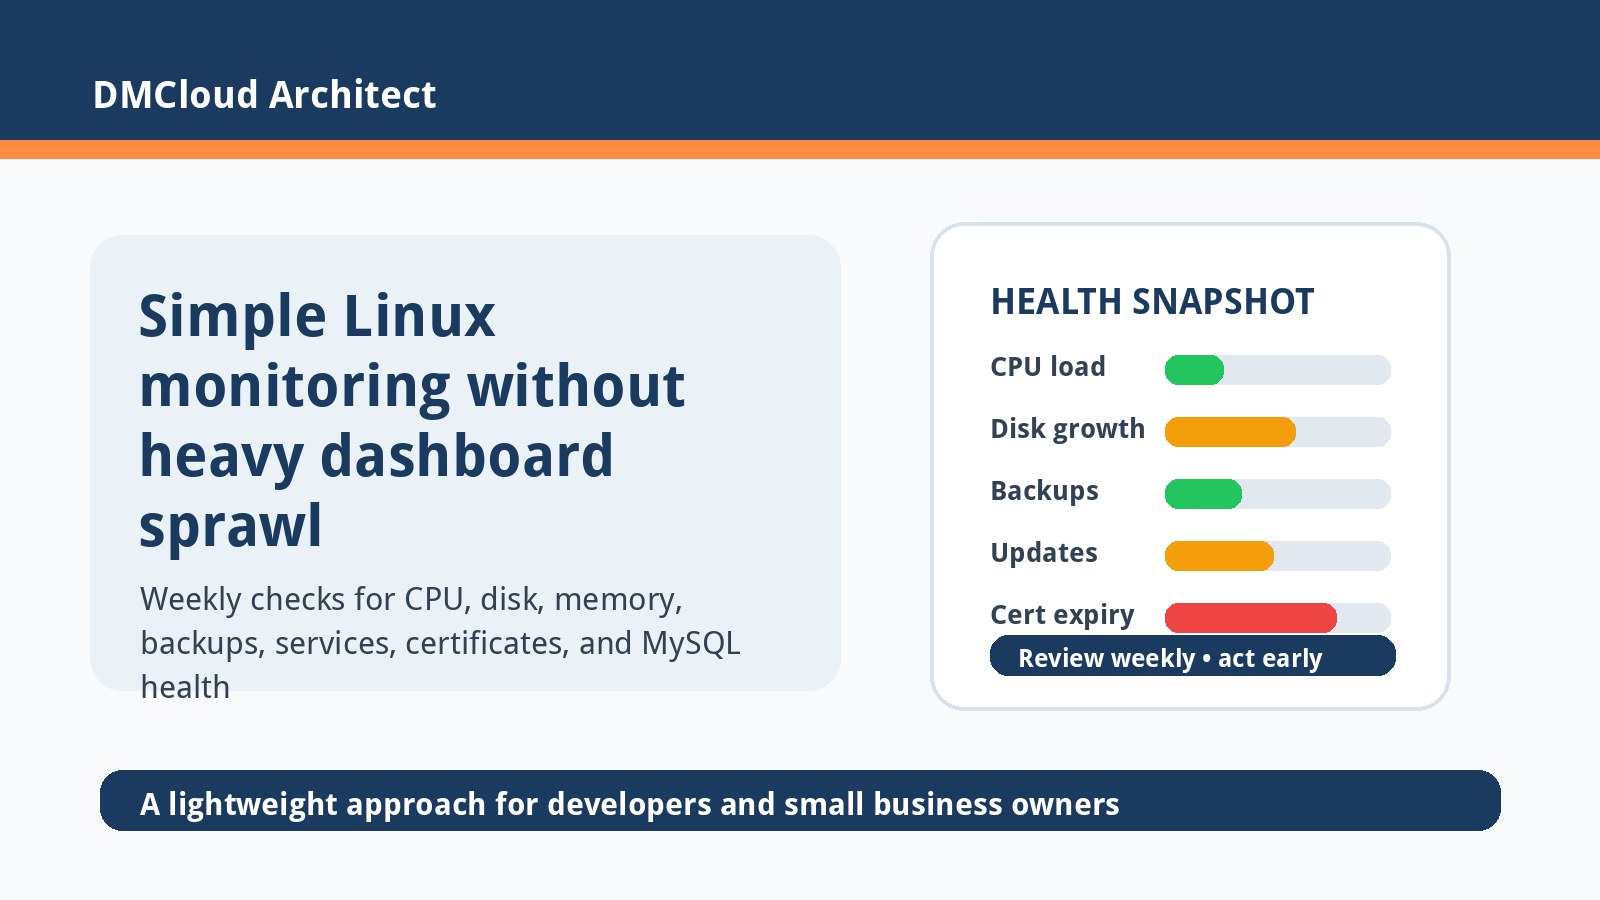
The easiest habit is to include disk forecasting alongside CPU load, memory pressure, failed services, backup status, update hygiene, certificates, and database health. A weekly infrastructure health report helps slow-moving storage risks stand out before they become urgent.

For small businesses, this is especially valuable because the person responsible for the server may also be responsible for customers, sales, or product work. A concise weekly report keeps the storage conversation practical: what changed, what matters, and what action should happen next.

Want disk growth warnings before they become outages?

DMCloud Architect provides weekly Linux and MySQL infrastructure health reports that surface disk growth, capacity trends, backups, certificates, and other operational risks in one practical summary.

Get the free starter plan for weekly infrastructure health reports.
About the Author
Mariusz Antonik

Oracle Cloud Infrastructure expert and consultant specializing in database management and automation.

All Tags
#Advanced #agent-visibility #alerts #amazon-linux-2023 #argo-cd #auditd #automation #backend-infrastructure #backup-verification #backups #bandwidth-monitoring #bare-metal-server #Bash #bash cpu monitoring script #bash monitoring #bash scripting #bash-scripts #Beginner #Best Practices #block volume backup #Capacity Planning #centos-ftp-migration #centralized-logging #cloud backup strategy #cloud-costs #cloud-database-setup #cloud-networking #cloudflare-workers #compute #container-monitoring #control-panel-security #cpu bottleneck #CPU Monitoring #cpu monitoring linux #cpu monitoring script linux #cpu trends #cpu usage trends #cpu usage trends linux #cpu-monitoring-script #cpu-monitoring-without-tools #cpu-performance-decline-server #cpu-performance-degradation-linux #cpu-usage-history-linux #create oracle db system in oci #cron #cron cpu monitoring #cron cpu monitoring linux #cron jobs #cron-monitoring #custom-linux-distribution #cve-advisory #database #database monitoring #database performance #database-health #database-setup #debian #detect slow queries mysql #devops #devops-checklist #devops-help #devops-learning #disk capacity planning server #disk forecasting linux #disk growth trend linux #Disk Monitoring #disk usage #disk usage script linux #disk usage trends #disk-capacity #disk-growth #disk-saturation-detection-linux #disk-usage-history-linux #Early Detection #easy infrastructure monitoring #elasticsearch #exposed-port-monitoring #fail2ban #field-server-checklist #firewall-rules #fleet-ops #free-tier #gitops-security #Guide #health dashboards #Health Reporting #historical server monitoring #historical-monitoring #home-lab #how to monitor cpu usage linux #https-certificates #infrastructure #infrastructure health #infrastructure health dashboard #infrastructure health reporting #infrastructure monitoring #infrastructure monitoring report #infrastructure trends #infrastructure trends monitoring #Infrastructure Visibility #infrastructure-automation #infrastructure-checklist #interview-prep #ip-allowlist #journald #kubernetes-security #lightweight linux monitoring #lightweight monitoring #lightweight-monitoring-solution #linux #linux administration #linux cpu monitoring #linux cpu usage #linux disk capacity planning #linux disk usage #Linux monitoring #linux monitoring setup #linux monitoring tools #linux performance #linux performance monitoring #linux server #linux server monitoring #linux servers #linux storage #linux tools #linux-admin #linux-disk-monitoring #linux-hardening #linux-hotspot #linux-monitoring-for-small-business #linux-networking #linux-performance-tuning #linux-remote-desktop #linux-security #linux-server-health #local-dns #log-management #log-retention #logrotate #loki #low maintenance monitoring #mkcert #monitor cpu usage over time linux #monitor linux server health #monitor server trends #monitor small production server #monitor-server-trends-over-time #monitoring #monitoring without complexity #monitoring-without-devops-team #MySQL #mysql health reporting #MySQL monitoring #mysql optimization #MySQL Performance #mysql performance degradation #mysql performance monitoring #mysql performance trends #mysql query performance issues #mysql server monitoring #mysql slow queries #mysql slow query analysis #mysql slow query monitoring #mysql trends #mysql-health #mysql-heatwave #mysql-monitoring-lightweight #mysql-workload-trends #networking #networkpolicy #nsg #OCI #oci backup #oci bastion tutorial #oci block volume #oci infrastructure as code #OCI monitoring #oci networking #oci oracle database private subnet setup #oci oracle database tutorial #oci security #oci setup guide #oci terraform tutorial #oci tutorial for beginners #oci vcn terraform #oci virtual machine db system guide #oci-database #oci-mysql-heatwave #oci-mysql-heatwave-tutorial #oci-subnets #offline-pwa #operations-checklist #oracle base database service tutorial #oracle cloud bastion #oracle cloud free tier tutorial #oracle cloud infrastructure step by step #oracle cloud infrastructure tutorial #oracle cloud storage #oracle database on oci setup #oracle-cloud #oracle-cloud-mysql-database-service #oracle-cloud-mysql-setup #oracle-cloud-vcn-setup #patch-management #path-mtu-discovery #Performance #Performance Degradation #performance monitoring #performance trend monitoring #performance trends #plan disk growth server #plesk #practical server monitoring #predict disk usage growth #private instance access #process-monitoring #proxmox #query optimization #query-trends #remote-workstation-security #rhel-tuned #rollback #route-tables #rsyslog #Security #security lists #security-monitoring #selinux #server #server health #server health reporting #server health weekly report #server monitoring #Server Performance #server trend analysis #server-audit #server-checklist #server-hardening #server-health-checklist #server-health-insights #server-security #server-security-audit #server-security-checklist #server-throughput #server-trends #server-troubleshooting #servers #service-worker #siem #simple cpu monitoring linux #simple linux monitoring #simple monitoring small business #simple monitoring system #simple ops monitoring #slow queries #slow query reporting mysql #small business infrastructure #small business IT #small business servers #small infrastructure monitoring #small server monitoring #small-business-security #small-business-tech #source-built-linux #ssh #ssh bastion #ssh-security #storage capacity planning linux #storage monitoring #subnets #sysadmin-checklist #sysadmin-lab #syscall-monitoring #System Health #system health reporting #systemd #tcp-mtu-probing #tcp-tuning #terraform oci compute #terraform oracle cloud infrastructure #track-disk-growth-linux #Trend Monitoring #trend-analysis #trends #tuned-adm #Tutorial #uptime-checks #uptime-monitoring #vcn #vcn-design #vector #vps-management #vsftpd #vulnerability-response #wazuh #weekly-server-report #windows-agent #xrdp