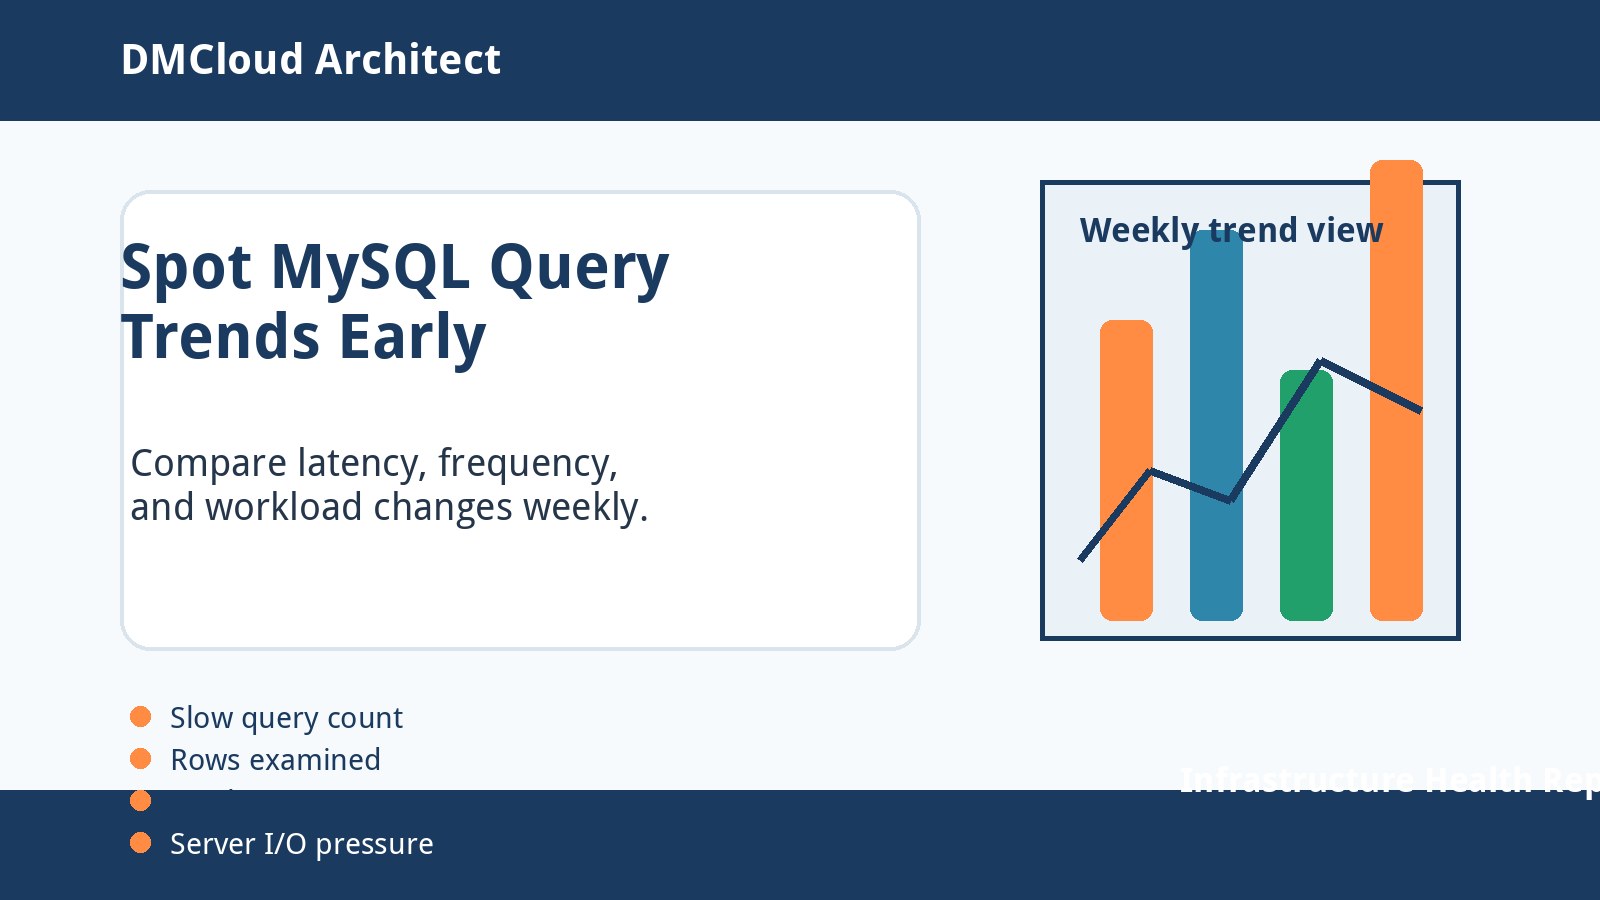
Database slowdowns rarely appear out of nowhere. They usually begin as small shifts: one report runs longer, a new endpoint adds more reads, a table grows past a comfortable size, or a background job starts competing with customer traffic. Watching MySQL query trends helps you catch those changes while there is still time to tune, archive, index, or reschedule work calmly.
Why query trends matter more than one slow query
A single slow query log entry can be useful, but it does not always tell the full story. One expensive query might be a harmless monthly report, while a formerly quick query that gets slower every week can become a customer-facing incident. Trend monitoring shows direction, not just today’s snapshot.
For small teams, this is especially valuable because there may not be a full-time database administrator watching dashboards. A lightweight weekly review can reveal whether MySQL performance trends are stable, gradually worsening, or suddenly changed after a deployment.
Start with the query mix
Track the balance of selects, inserts, updates, deletes, temporary tables, and full table scans. When the mix changes, the database may need different indexes, different caching, or a different maintenance schedule. A new feature that adds frequent write activity can stress storage and locking in a way that average CPU alone will not explain.
If you have performance schema enabled, use it to summarize statements by digest. If not, start with slow query logs and application-level timing for the busiest endpoints. The goal is to see which query families are gaining time or frequency, not to collect every possible metric.
Compare average time, frequency, and total impact
Query tuning conversations often focus on the slowest single statement, but total impact comes from both duration and frequency. A query that takes two seconds once a day is usually less urgent than a query that takes 200 milliseconds thousands of times per hour. Review average latency, execution count, and total time together.
This makes MySQL trend monitoring more practical. You can prioritize the query patterns that are actually consuming server time, then decide whether the fix is an index, a code change, a cache, pagination, archiving, or a scheduled job adjustment.
Watch for slow performance over time
Slow performance over time is often caused by data growth rather than a broken deployment. Tables get larger, indexes become less selective, and once-fast joins start reading more rows. Weekly comparisons help you see whether latency is moving gradually upward even when error rates still look clean.
Pay attention to queries whose average runtime, rows examined, temporary table usage, or sort activity increases week over week. These are the early warnings that a workload is outgrowing its original assumptions.
Connect query changes to business events
Raw database numbers are easier to interpret when they are tied to context. Note deployments, marketing campaigns, imports, monthly billing runs, reporting jobs, and customer onboarding spikes. If a query trend changed the same week a new workflow launched, the investigation starts with a useful clue.
This context also helps avoid false alarms. A predictable end-of-month reporting spike may be acceptable if it stays bounded, while the same increase during normal business hours may require action.
Use a simple weekly checklist
- Review the top query digests by total execution time.
- Compare slow query counts with the previous week.
- Look for queries with rising average duration or rows examined.
- Check whether temporary tables, filesorts, or full table scans increased.
- Compare database CPU, memory pressure, disk I/O, and connection counts with query changes.
- Document deployments, imports, reports, or traffic events that explain workload shifts.
- Choose one practical follow-up: tune an index, rewrite a query, archive data, move a job, or keep watching.
Do not ignore server health signals
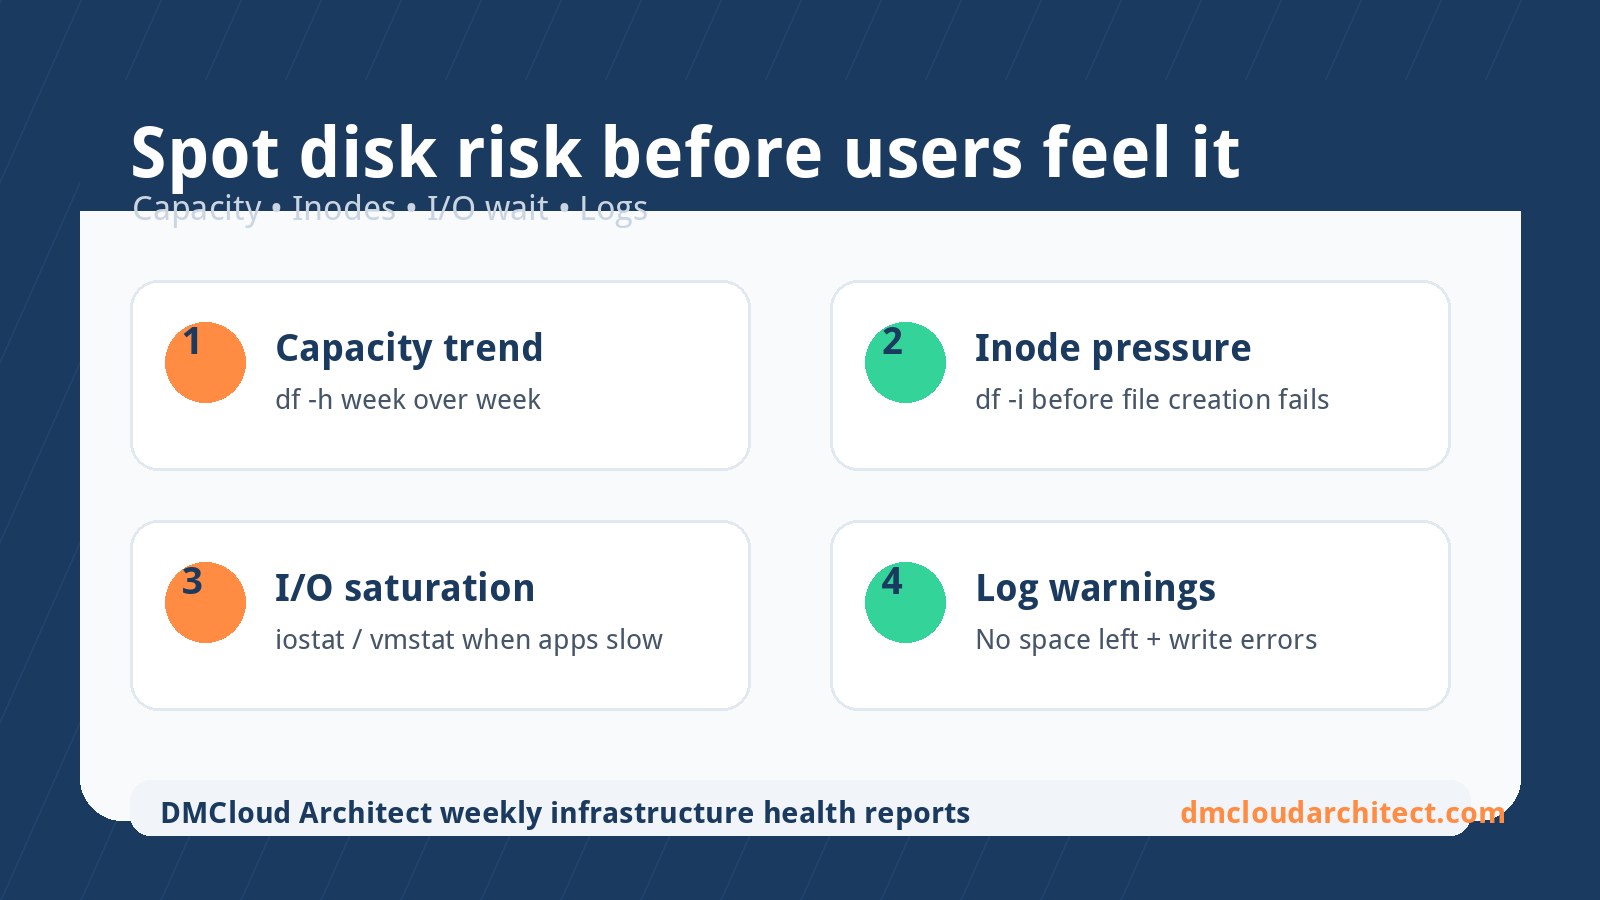
Query behavior and server health are connected. A query may look slower because storage is saturated, memory pressure is forcing more disk reads, or backups are competing for I/O. Review MySQL workload trends alongside CPU load, disk wait, free memory, disk capacity, and backup timing.
This prevents misdiagnosis. If many unrelated queries slow down at the same time, the cause may be infrastructure pressure rather than a single bad statement.
Turn findings into small, safe improvements
Trend data is most useful when it leads to action. Start with low-risk changes: add a missing index after testing, limit report date ranges, move batch jobs outside peak hours, archive old rows, or cache an expensive lookup. Record the change and compare the next weekly snapshot to confirm whether it helped.
For bigger fixes, use the trend history to justify the work. It is much easier to prioritize database cleanup or query refactoring when you can show that execution time has increased steadily for several weeks.
Summary
Tracking mysql query trends gives you an early-warning system for database performance degradation. Review query mix, execution count, average duration, total impact, and related server health signals on a regular schedule. With a simple weekly habit, developers and small business owners can spot MySQL performance degradation before it becomes an urgent customer problem.
Want a practical weekly view of Linux and MySQL health trends? Get the free starter plan for weekly infrastructure health reports.