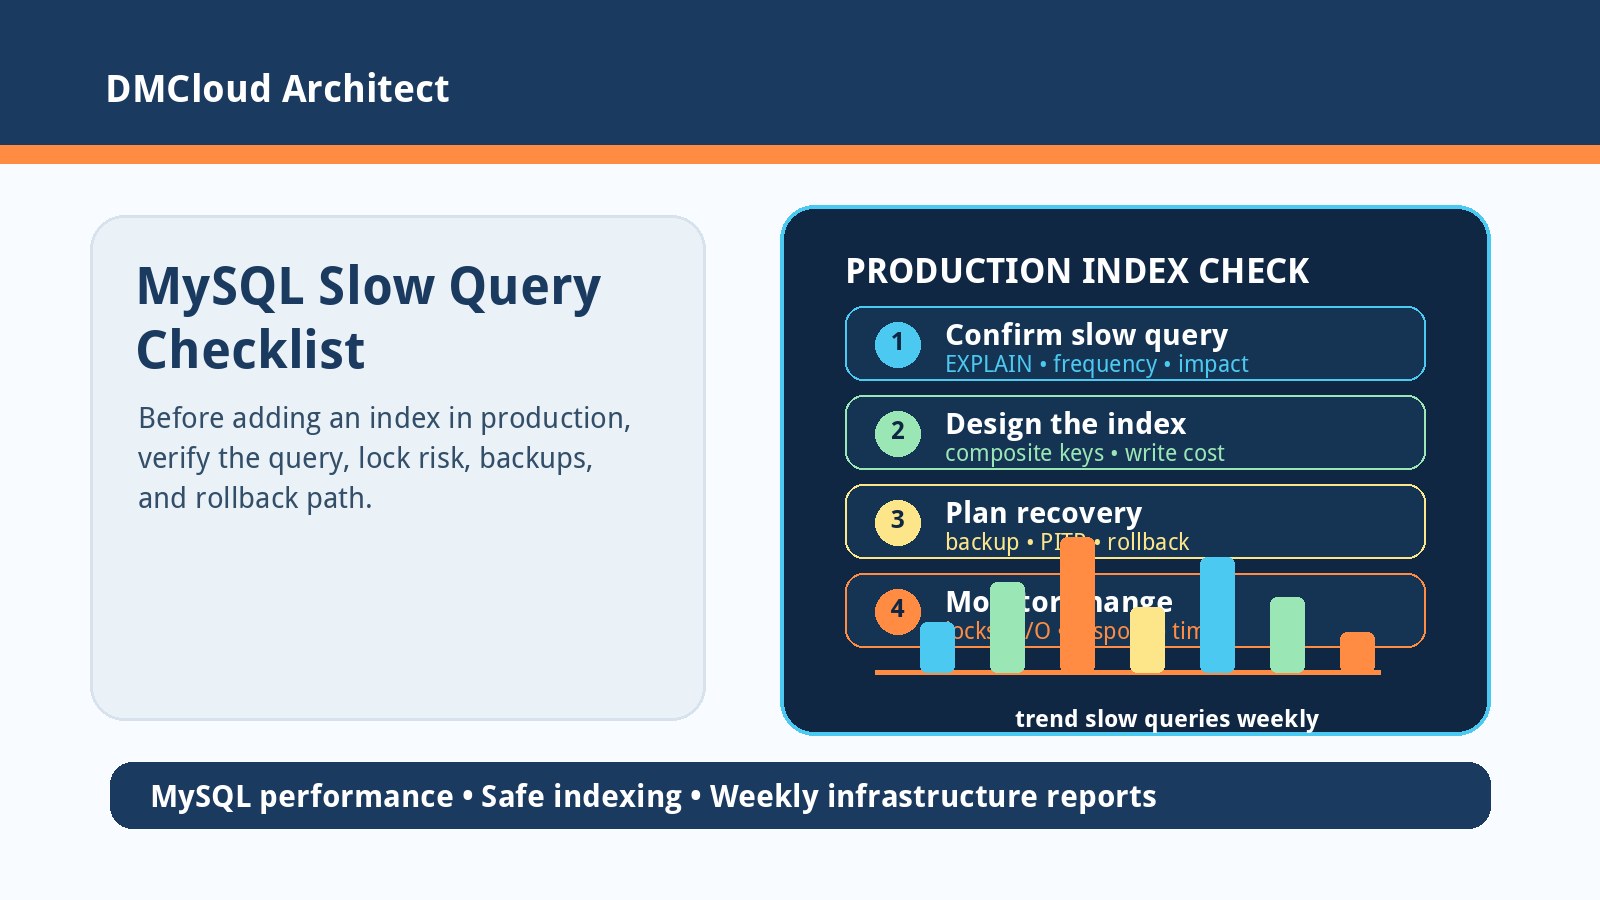
A mysql slow query often starts as one painful screen in an application: a report takes too long, a checkout step pauses, or an admin page times out. The tempting fix is to add the missing index immediately, especially when EXPLAIN seems to point at one column. On a production server, the safer path is to confirm the diagnosis, understand the migration risk, and make the change in a way you can roll back or recover from.
This checklist is written for developers and small business owners who do not have a full database operations team on call. It explains what to check before adding an index, how to reduce production risk, and how weekly MySQL health reporting can make slow-query work less reactive.
1. Confirm the slow query before changing the schema
Do not start with the index statement. Start by proving which query is slow, how often it runs, and whether it is slow because of missing indexing or because the server is under resource pressure.
- Capture the exact SQL shape. Parameter values may change, but you need the actual tables, joins, filters, sort order, and limit pattern.
- Check frequency and impact. A once-a-month report has a different risk profile from a query that runs on every customer request.
- Use
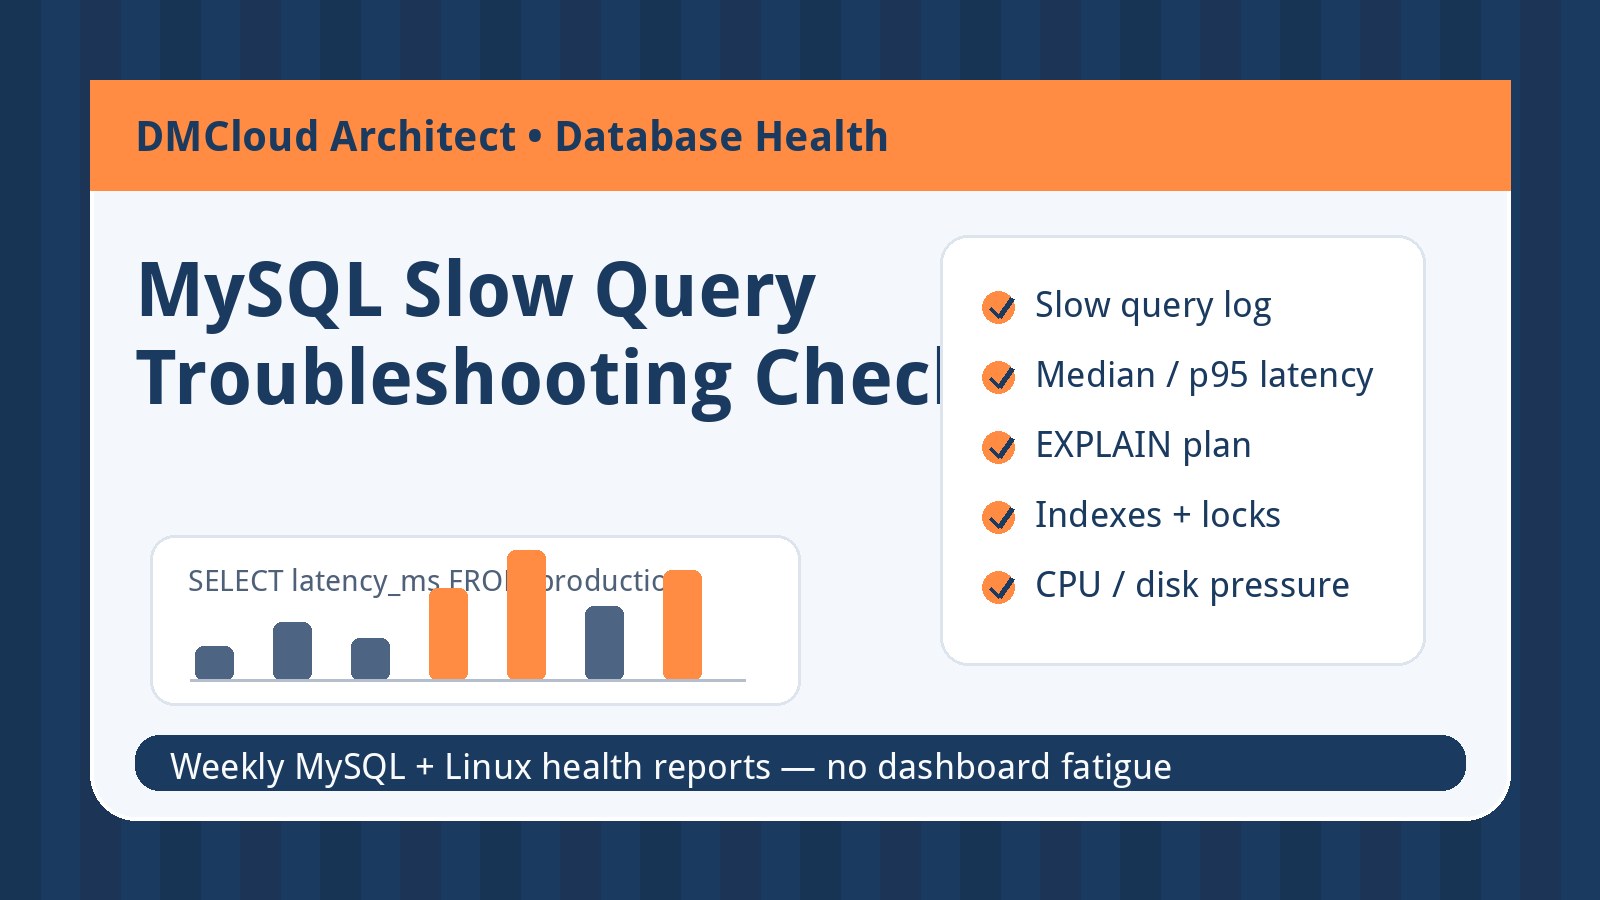
EXPLAINorEXPLAIN ANALYZEwhere available. Look for full table scans, poor join order, filesort, temporary tables, and row estimates that are far from reality. - Compare with server health. High CPU, I/O wait, memory pressure, lock waits, or a saturated connection pool can make a query look worse than it is.
If the query is slow only during backup windows, batch imports, or traffic spikes, an index may still help, but it may not be the whole fix. A good troubleshooting note should say, “This query scans this many rows because this predicate has no useful index,” not just, “The database is slow.”
2. Design the index around the real access pattern
An index is not simply “put one on the column in the WHERE clause.” The best index depends on equality filters, range filters, join columns, sort order, cardinality, and whether the query can benefit from a composite index.
- Favor the query pattern, not a single column guess. For example,
WHERE account_id = ? AND status = ? ORDER BY created_at DESCmay need a composite index rather than three separate indexes. - Watch low-cardinality columns. Indexing a column with only a few values can be less useful unless it is part of a larger composite index.
- Check existing indexes first. Duplicate or overlapping indexes increase write cost and maintenance overhead.
- Think about writes. Every insert, update, and delete must maintain the index. A read fix can become a write slowdown if added casually.
For a production mysql slow query, the goal is not to add the most indexes. The goal is to add the smallest useful index that improves the important query without creating avoidable write or storage cost.
3. Test the change somewhere safer than production first
Testing on a tiny development database can be misleading because the optimizer behaves differently when tables are small. Still, you should test syntax, application compatibility, and the broad query plan before production.
- Run the migration in staging if available. Use production-like table sizes when you can.
- Record before-and-after query plans. Save
EXPLAINoutput so you can prove what changed. - Check disk space. Large indexes need room while building and room after completion.
- Estimate runtime. A table with millions of rows can take long enough to matter, even with online DDL.
- Test application behavior. The migration may be safe, but the application still needs validation under normal workflows.
If you cannot build a realistic staging copy, at least test the statement on a recent backup restore. That also proves your backup process is usable, which matters if the production change goes badly.
4. Understand locking and online DDL before you run it
Modern MySQL versions can add many indexes with online DDL options, but “online” does not mean “zero risk.” There may still be metadata locks, resource load, replication lag, temporary disk usage, or moments where the change waits behind another transaction.
- Check your MySQL version and storage engine. InnoDB behavior differs by version and operation.
- Use explicit DDL options when appropriate. If your version supports it, review
ALGORITHM=INPLACEorALGORITHM=INSTANTandLOCK=NONE, but verify they apply to the specific operation. - Look for long-running transactions first. A schema change can wait for metadata locks and surprise you at the worst time.
- Run during a low-traffic window. Even non-blocking changes consume CPU, I/O, and buffer pool attention.
- Monitor replication if you use it. Index builds and related load can create lag.
Running the statement from MySQL Workbench, a CLI session on a VM, or a migration tool is less important than controlling the process. Use a method that gives you logging, a stable connection, a reviewed command, and a clear stop/recovery plan.
5. Prepare recovery before touching production
The safest production database changes are boring because the recovery plan is ready before the command starts. For a small business server, that usually means confirming recent backups, understanding point-in-time recovery, and knowing who can make the call if performance degrades.
- Confirm a recent backup exists. Do not assume scheduled backups ran; verify the latest backup time and result.
- Know whether point-in-time recovery is available. Snapshots help, but binary logs or managed PITR may be needed to recover to a precise moment.
- Save the exact rollback command. For an index, rollback may be
DROP INDEX index_name ON table_name, but dropping can also have operational impact. - Write down the stop conditions. Decide what CPU, lock wait, replication lag, error rate, or user impact means “pause and reassess.”
- Have a communication note ready. If customers may feel the change, prepare a plain-language maintenance explanation.
A snapshot is useful, but restoring a large database snapshot is rarely instant. Treat backups as recovery tools, not permission to skip careful change planning.
6. Run the production change as a controlled maintenance task
When the diagnosis and recovery plan are ready, make the production change with a short checklist rather than an improvised click in a client tool.
- Use a reviewed migration statement. Keep it in a ticket, migration file, or change note.
- Run one change at a time. Avoid mixing an index build with unrelated schema cleanup.
- Keep the session observable. Watch process list, lock waits, CPU, disk I/O, and application errors.
- Record start and finish times. This helps explain performance graphs and future maintenance estimates.
- Verify the index is used afterward. Rerun the query plan and compare real response time, not just successful DDL completion.
For many small systems, adding the right index is routine. The risk comes from doing it without evidence, during busy traffic, with no recovery proof, or while another database issue is already active.
7. Add slow-query review to weekly health reporting
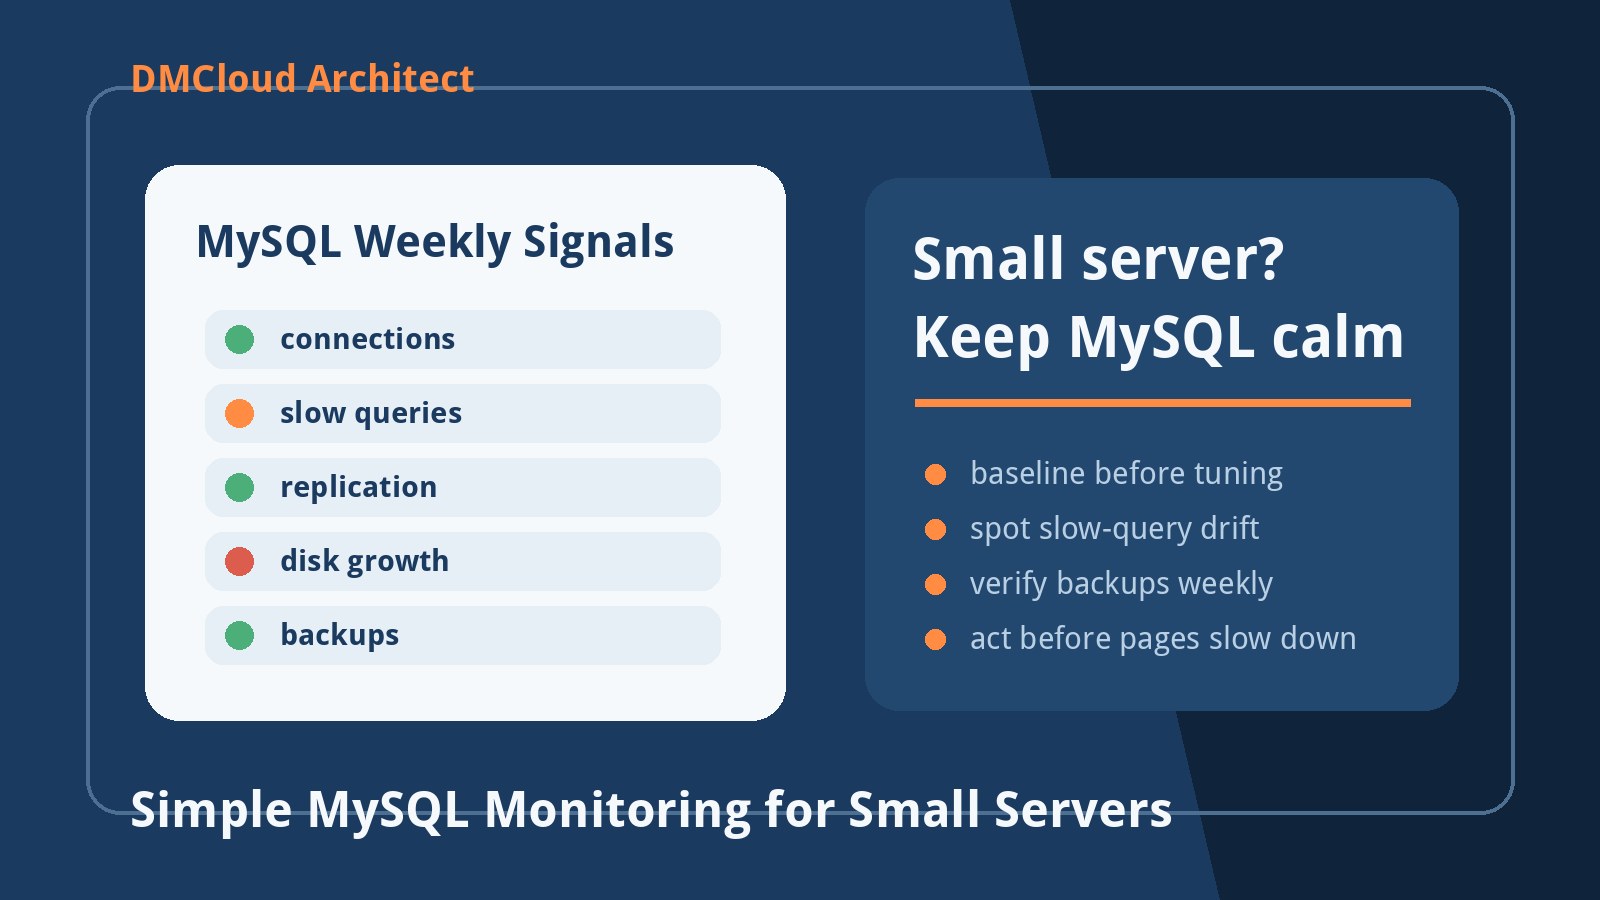
Slow-query work should not depend on someone noticing a timeout and making a rushed schema change. A weekly MySQL health report can surface the pattern earlier: top slow queries, query count changes, table growth, new full scans, index bloat, replication lag, and resource pressure around database peaks.
- Trend slow queries over time. A query that gets 10% slower every week is easier to fix before customers notice.
- Connect database symptoms to server metrics. CPU steal, disk I/O, memory, and storage growth give context to query latency.
- Separate urgent items from watch items. Not every slow query is an emergency, but repeated growth needs ownership.
- Keep recommendations practical. “Review index for orders(account_id, status, created_at)” is more useful than “Database performance degraded.”
This turns database performance from a panic task into a maintenance routine. Developers get enough detail to act, while business owners get a clear risk summary without another dashboard to watch.
Want MySQL slow-query risks found before users complain?
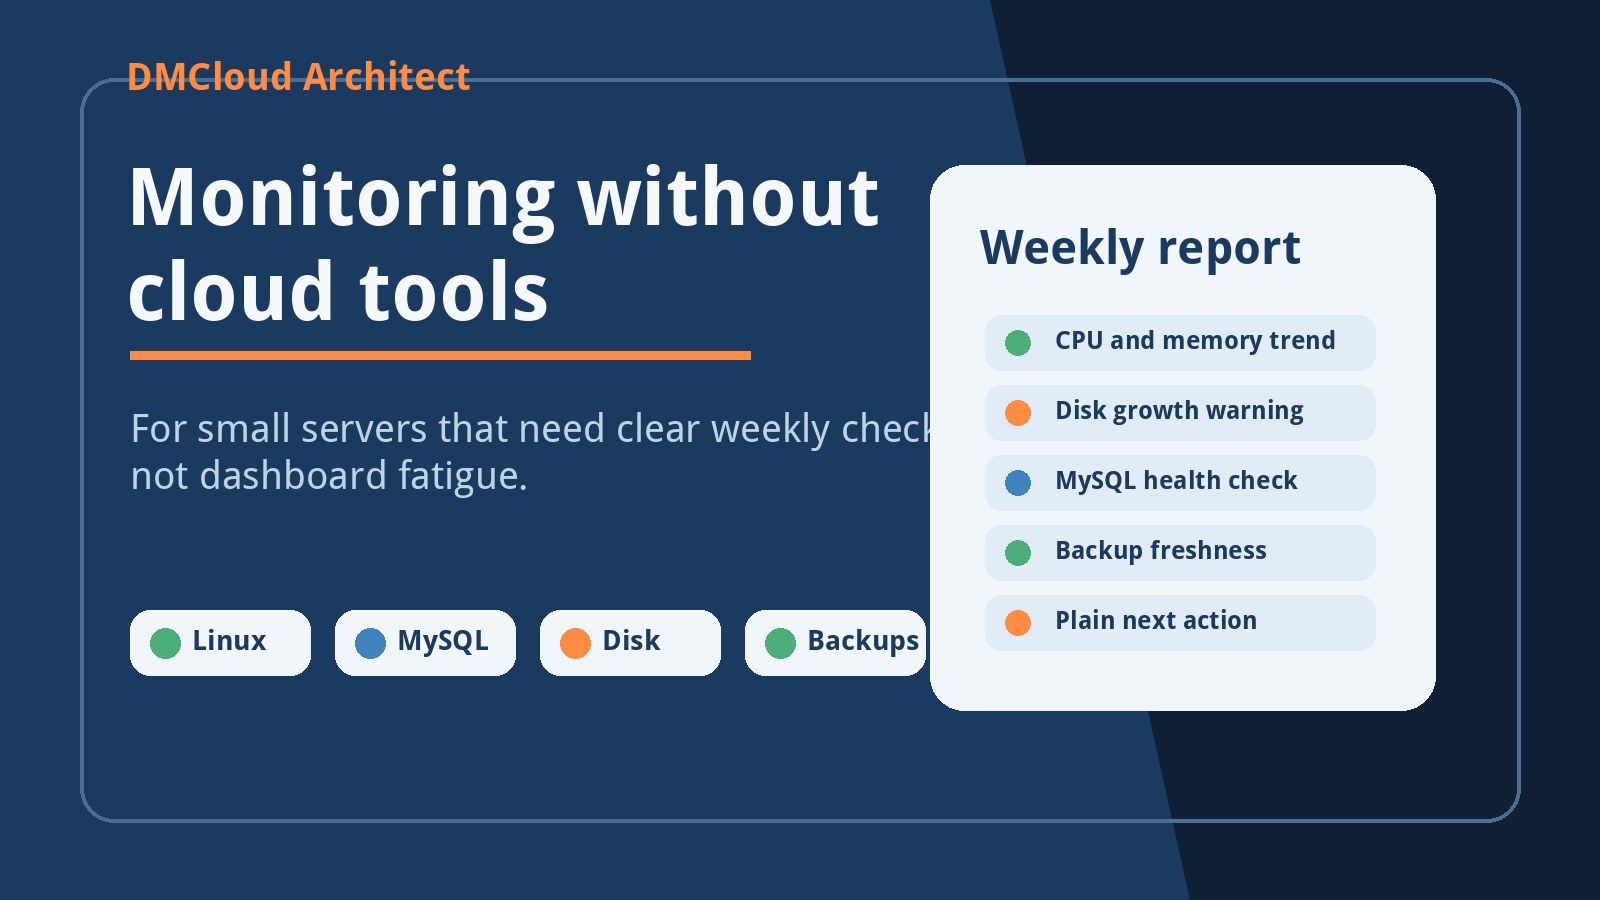
DMCloud Architect sends weekly Linux and MySQL infrastructure health reports directly to your inbox, highlighting slow queries, resource pressure, disk growth, and practical next steps without adding dashboard fatigue.
Get the free starter plan for weekly infrastructure health reports.