Back to Blog
Simple MySQL Monitoring for Small Servers: What to Check Each Week

Simple MySQL Monitoring for Small Servers: What to Check Each Week

   Mariusz Antonik    Database    5 min read    7 views

A small MySQL server can run quietly for years, right up until a few slow queries, a fuller disk, or a missing backup turns into a business problem. The tricky part is that early warning signs are usually boring. They show up as gradual growth, repeated waits, and small delays before anyone reports that the website or internal app feels slow.

That is why mysql monitoring small server work should be simple, repeatable, and focused on decisions. You do not need a noisy dashboard for every metric. You need a weekly check that tells you whether MySQL is healthy, drifting, or asking for maintenance.

Start with the questions that matter

Good MySQL monitoring begins with practical business questions, not a wall of charts. Is the database responding normally during working hours? Are slow queries becoming more common? Is disk usage growing faster than expected? Are backups completing and proving they can be restored?

For developers and small business owners, these questions are easier to act on than raw numbers alone. A weekly health report should translate MySQL signals into clear next steps: no action, investigate a query, clean up storage, adjust a job schedule, or plan a capacity change.

Check slow queries before they become normal

Slow queries are one of the most useful early warnings on a small server. A single slow query may be harmless, but a growing pattern usually means indexes, data volume, application changes, or reports are starting to put pressure on the database.

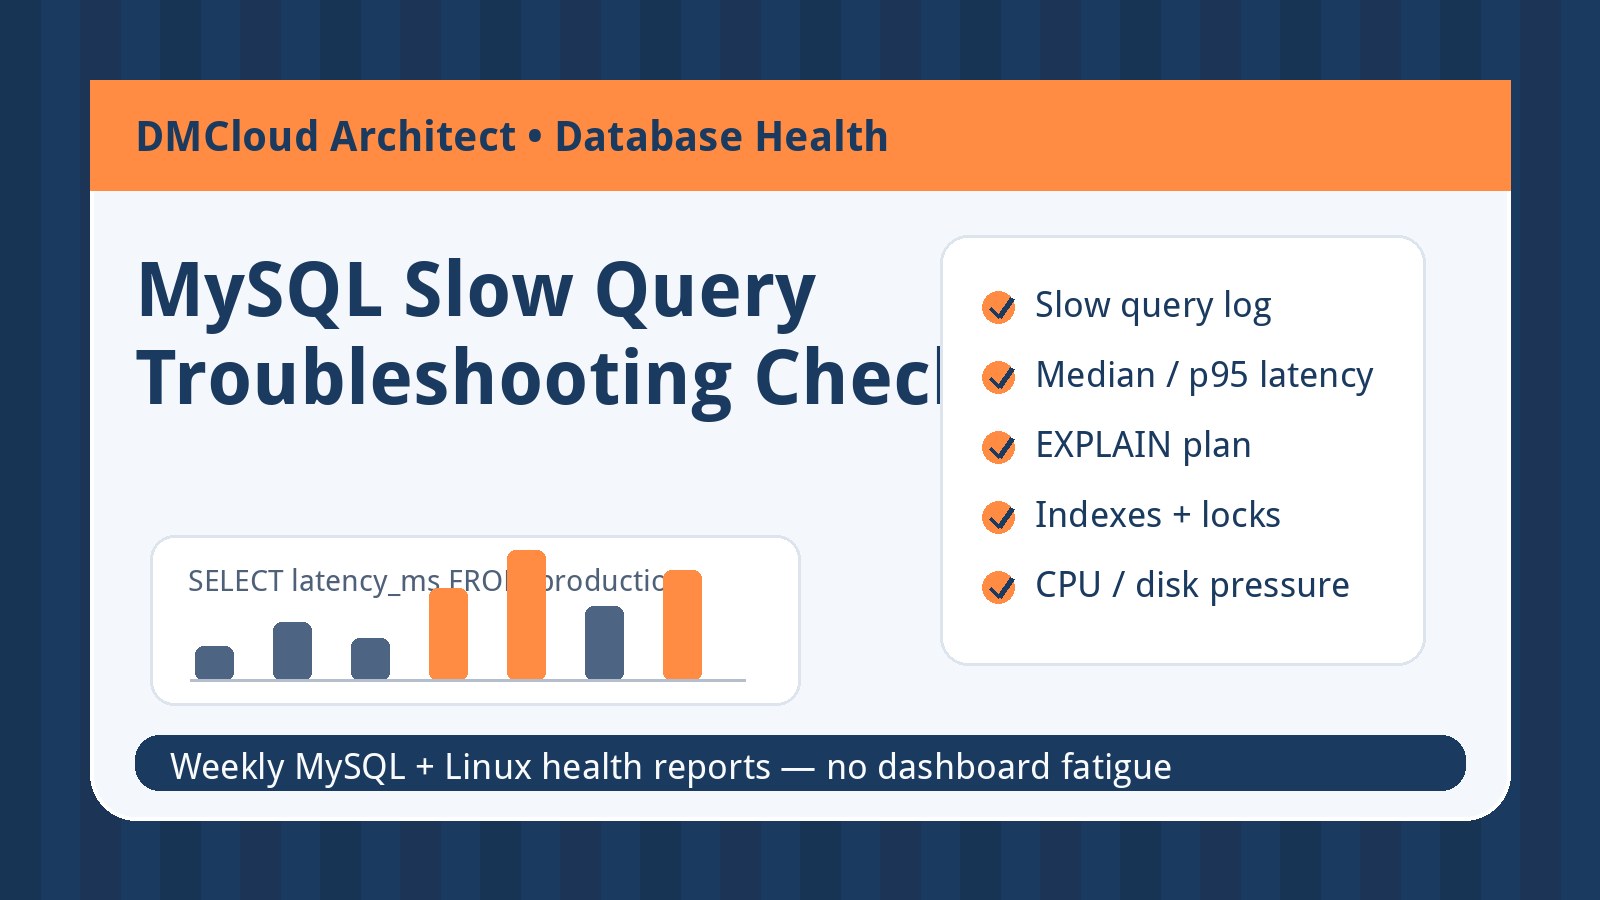
  • Enable the slow query log with a threshold that matches the application, not just the default.
  • Review the most repeated slow queries, not only the slowest one-off query.
  • Compare this week with the previous few weeks so growth is visible.
  • Connect slow queries to user-facing pages, admin reports, imports, or scheduled jobs.

This kind of mysql performance monitoring helps avoid a common mistake: upgrading the server before confirming whether one query, missing index, or report job is causing most of the pain.

Watch connection pressure and thread usage

Small servers often fail in ordinary ways. Too many application workers, a stuck script, or a connection pool with poor limits can push MySQL toward connection exhaustion. When that happens, the website may show intermittent errors even if CPU and memory look acceptable.

Track current connections, max used connections, aborted connections, and connection errors. If the numbers rise during the same business process each week, investigate that process rather than treating the symptom as random. A stable connection pattern is a good sign; a pattern that keeps climbing deserves attention.

Measure disk growth and table size

Disk space problems are easy to overlook because MySQL can look healthy until the storage layer is not. Binlogs, temporary tables, old backups, log files, and growing application tables can quietly fill the same volume.

  • Record database size and disk free space every week.
  • List the fastest-growing tables, not just the total database size.
  • Confirm binary log retention is intentional.
  • Check temporary file locations and backup destinations.

For mysql server monitoring on a small instance, disk growth should be treated as a capacity trend. If the server is losing storage headroom every week, you have time to archive, clean up, resize, or move backups before MySQL stops writing safely.

Make backup checks visible

A backup job that exits successfully is not the same as a usable recovery plan. Weekly MySQL health reporting should confirm that backups completed, that backup files are recent, and that the restore process has been tested often enough to trust it.

The useful report is plain: last backup time, backup size, retention status, restore-test date, and any error messages. Small teams do not need a complex backup dashboard. They need confidence that a database mistake or server failure will not become a permanent data loss event.

Include replication and availability when they exist

If the small server uses replication, include replication lag, replica SQL thread state, IO thread state, and recent replication errors in the weekly check. Even a simple read replica can drift silently if nobody reviews it.

If there is no replica, monitor availability from the outside. A local MySQL process check is useful, but it does not prove the application can connect. Combine database status with an application-level check that confirms real business paths can still reach the database.

Keep the weekly report short enough to read

The best mysql health reporting for a small server is not a giant export. It is a concise summary with a few sections: healthy signals, changed signals, risks, and recommended action. That makes the report useful for both the developer and the business owner.

A simple format works well:

  • Status: healthy, watch, or action needed.
  • What changed: slow queries, disk growth, connections, backups, or replication.
  • Why it matters: the likely business or application impact.
  • Next action: one clear maintenance step.

A practical weekly checklist

If you want a lightweight starting point, review these signals once a week:

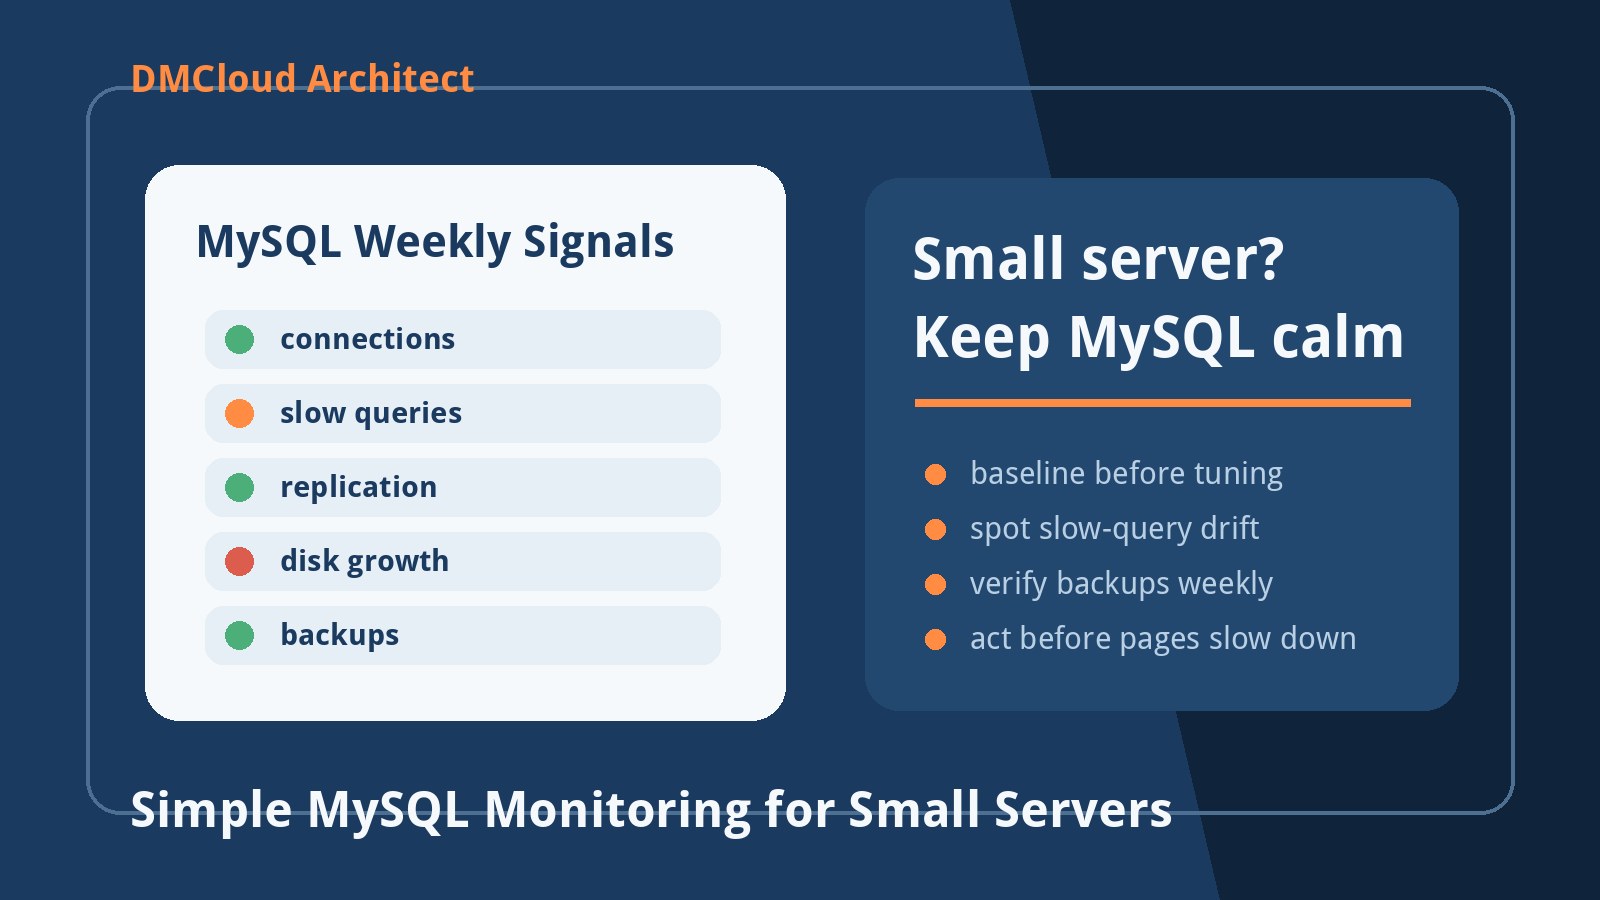
  • Slow query count and the top repeated slow queries.
  • Current connections, max used connections, and aborted connections.
  • Database size, free disk space, binlog growth, and largest tables.
  • Backup completion, backup size, retention, and latest restore test.
  • Replication health or external application connectivity.
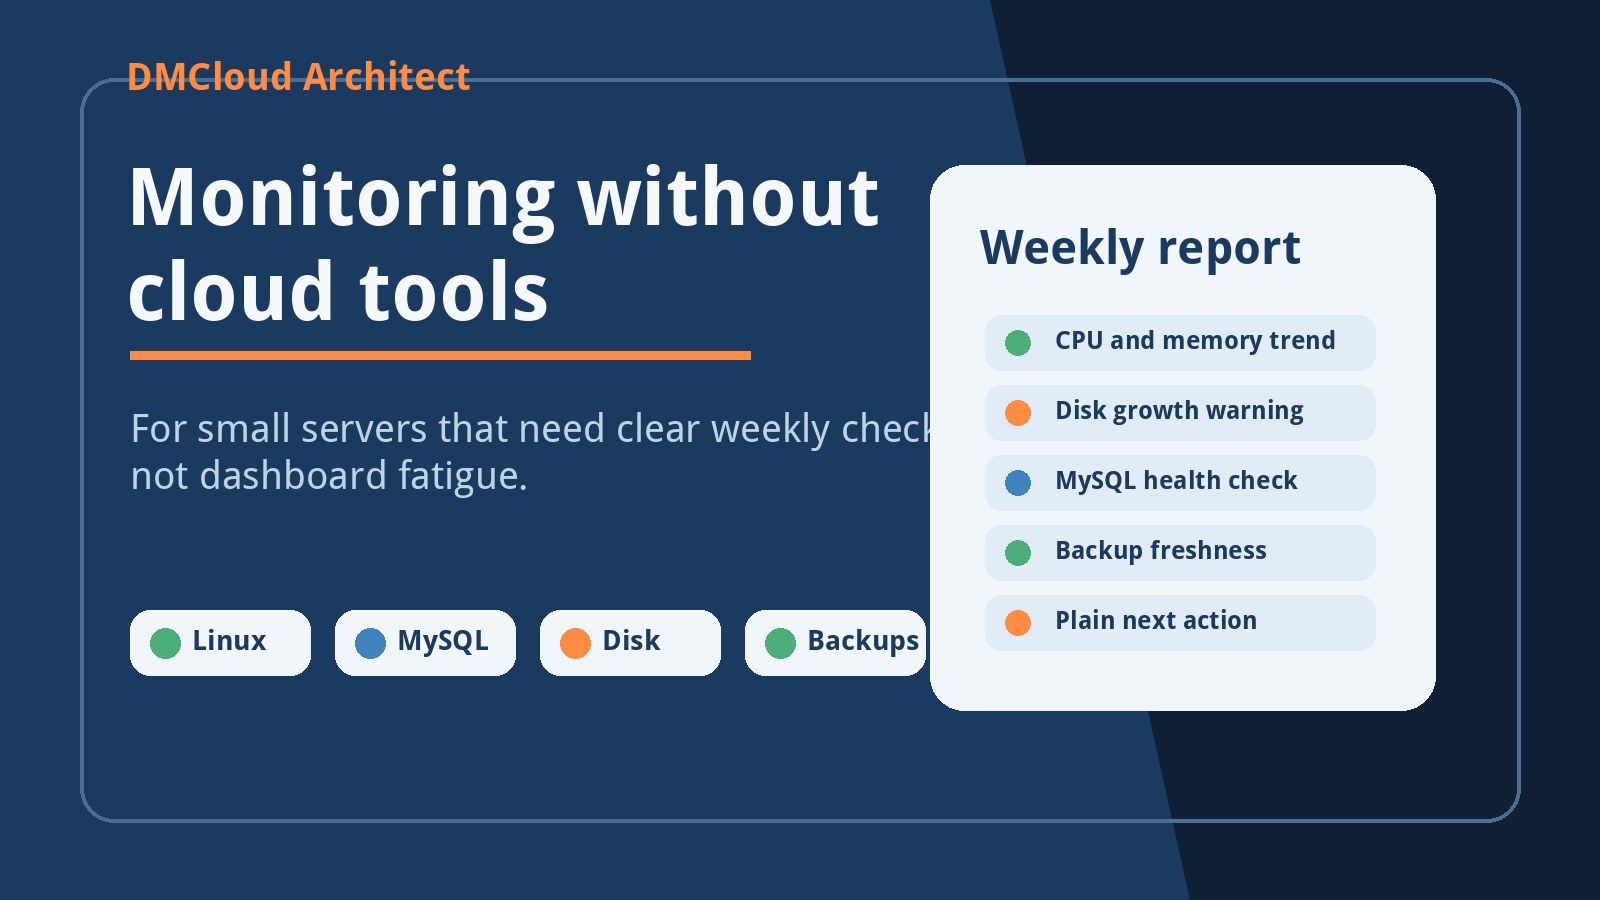
  • CPU, memory, and disk I/O trends during normal business hours.

This is mysql monitoring simple enough for a lean team but strong enough to catch many problems early. The goal is not to prove that every metric is perfect. The goal is to notice the important changes while there is still time to fix them calmly.

Want weekly MySQL monitoring without another dashboard?

DMCloud Architect provides weekly infrastructure health reports for Linux and MySQL servers, with plain-language risks and practical next actions for developers and small business owners.

Get the free starter plan for weekly infrastructure health reports.
About the Author
Mariusz Antonik

Oracle Cloud Infrastructure expert and consultant specializing in database management and automation.

All Tags
#Advanced #agent-visibility #alerts #amazon-linux-2023 #argo-cd #auditd #automation #backend-infrastructure #backup-verification #backups #bandwidth-monitoring #bare-metal-server #Bash #bash cpu monitoring script #bash monitoring #bash scripting #bash-automation #bash-scripts #Beginner #Best Practices #block volume backup #Capacity Planning #centos-ftp-migration #centralized-logging #chromebook-linux #cloud backup strategy #cloud-costs #cloud-database-setup #cloud-networking #cloudflare-workers #compute #container-monitoring #control-panel-security #cpu bottleneck #CPU Monitoring #cpu monitoring linux #cpu monitoring script linux #cpu trends #cpu usage trends #cpu usage trends linux #cpu-monitoring-script #cpu-monitoring-without-tools #cpu-performance-decline-server #cpu-performance-degradation-linux #cpu-usage-history-linux #create oracle db system in oci #cron #cron cpu monitoring #cron cpu monitoring linux #cron jobs #cron-monitoring #custom-linux-distribution #cve-advisory #database #database monitoring #database performance #database-health #database-setup #debian #detect slow queries mysql #devops #devops-checklist #devops-help #devops-learning #disk capacity planning server #disk forecasting linux #disk growth trend linux #Disk Monitoring #disk usage #disk usage script linux #disk usage trends #disk-capacity #disk-growth #disk-saturation-detection-linux #disk-usage-history-linux #Early Detection #easy infrastructure monitoring #egress-monitoring #elasticsearch #exposed-port-monitoring #fail2ban #field-server-checklist #firewall-rules #fleet-ops #free-tier #gitops-security #Guide #health dashboards #Health Reporting #historical server monitoring #historical-monitoring #home-lab #how to monitor cpu usage linux #https-certificates #infrastructure #infrastructure health #infrastructure health dashboard #infrastructure health reporting #infrastructure monitoring #infrastructure monitoring report #infrastructure trends #infrastructure trends monitoring #Infrastructure Visibility #infrastructure-automation #infrastructure-checklist #infrastructure-reporting #interview-prep #ip-allowlist #journald #kubernetes-security #latency-checks #lightweight linux monitoring #lightweight monitoring #lightweight-monitoring-solution #linux #linux administration #linux cpu monitoring #linux cpu usage #linux disk capacity planning #linux disk usage #Linux monitoring #linux monitoring setup #linux monitoring tools #linux performance #linux performance monitoring #linux server #linux server monitoring #linux servers #linux storage #linux tools #linux-admin #linux-disk-monitoring #linux-hardening #linux-hotspot #linux-monitoring-for-small-business #linux-networking #linux-performance-tuning #linux-remote-desktop #linux-security #linux-server-health #local-dns #local-network #log-management #log-retention #logrotate #loki #low maintenance monitoring #mkcert #monitor cpu usage over time linux #monitor linux server health #monitor server trends #monitor small production server #monitor-server-trends-over-time #monitoring #monitoring without complexity #monitoring-without-devops-team #MySQL #mysql health reporting #MySQL monitoring #mysql optimization #MySQL Performance #mysql performance degradation #mysql performance monitoring #mysql performance trends #mysql query performance issues #mysql server monitoring #mysql slow queries #mysql slow query analysis #mysql slow query monitoring #mysql trends #mysql-health #mysql-heatwave #mysql-monitoring-lightweight #mysql-slow-query #mysql-workload-trends #network-monitoring #networking #networkpolicy #node-express #nsg #OCI #oci backup #oci bastion tutorial #oci block volume #oci infrastructure as code #OCI monitoring #oci networking #oci oracle database private subnet setup #oci oracle database tutorial #oci security #oci setup guide #oci terraform tutorial #oci tutorial for beginners #oci vcn terraform #oci virtual machine db system guide #oci-database #oci-mysql-heatwave #oci-mysql-heatwave-tutorial #oci-subnets #offline-pwa #operations-checklist #oracle base database service tutorial #oracle cloud bastion #oracle cloud free tier tutorial #oracle cloud infrastructure step by step #oracle cloud infrastructure tutorial #oracle cloud storage #oracle database on oci setup #oracle-cloud #oracle-cloud-mysql-database-service #oracle-cloud-mysql-setup #oracle-cloud-vcn-setup #outbound-connections #patch-management #path-mtu-discovery #Performance #Performance Degradation #performance monitoring #performance trend monitoring #performance trends #ping-monitoring #plan disk growth server #plesk #practical server monitoring #predict disk usage growth #private instance access #process-monitoring #production-troubleshooting #proxmox #query optimization #query-trends #remote-workstation-security #rhel-tuned #rollback #route-tables #rsyslog #Security #security lists #security-monitoring #selinux #server #server health #server health reporting #server health weekly report #server monitoring #Server Performance #server trend analysis #server-audit #server-checklist #server-hardening #server-health-checklist #server-health-insights #server-security #server-security-audit #server-security-checklist #server-throughput #server-trends #server-troubleshooting #servers #service-worker #siem #simple cpu monitoring linux #simple linux monitoring #simple monitoring small business #simple monitoring system #simple ops monitoring #slow queries #slow query reporting mysql #slow-query-log #small business infrastructure #small business IT #small business servers #small infrastructure monitoring #small server monitoring #small-business-monitoring #small-business-security #small-business-tech #source-built-linux #ssh #ssh bastion #ssh-security #storage capacity planning linux #storage monitoring #subnets #sysadmin-checklist #sysadmin-lab #syscall-monitoring #System Health #system health reporting #systemd #tcp-mtu-probing #tcp-tuning #terraform oci compute #terraform oracle cloud infrastructure #track-disk-growth-linux #Trend Monitoring #trend-analysis #trends #tuned-adm #Tutorial #uptime-checks #uptime-monitoring #vcn #vcn-design #vector #vps-management #vsftpd #vulnerability-response #wazuh #weekly-reports #weekly-server-report #windows-agent #xrdp