MySQL Slow Query Analysis: Practical Guide for Performance
Introduction: When Queries Quietly Become a Problem
Most MySQL performance issues don’t appear suddenly. They build slowly over time—queries that once ran in milliseconds begin taking seconds, and eventually minutes. By the time users notice, the database is already under stress. This is where mysql slow query analysis becomes essential for maintaining stable performance.
Why Slow Query Analysis Matters
Slow queries are one of the most common causes of database performance degradation. They increase CPU usage, create lock contention, and can impact overall system responsiveness. Without visibility, teams often react too late, only addressing issues after they affect applications.
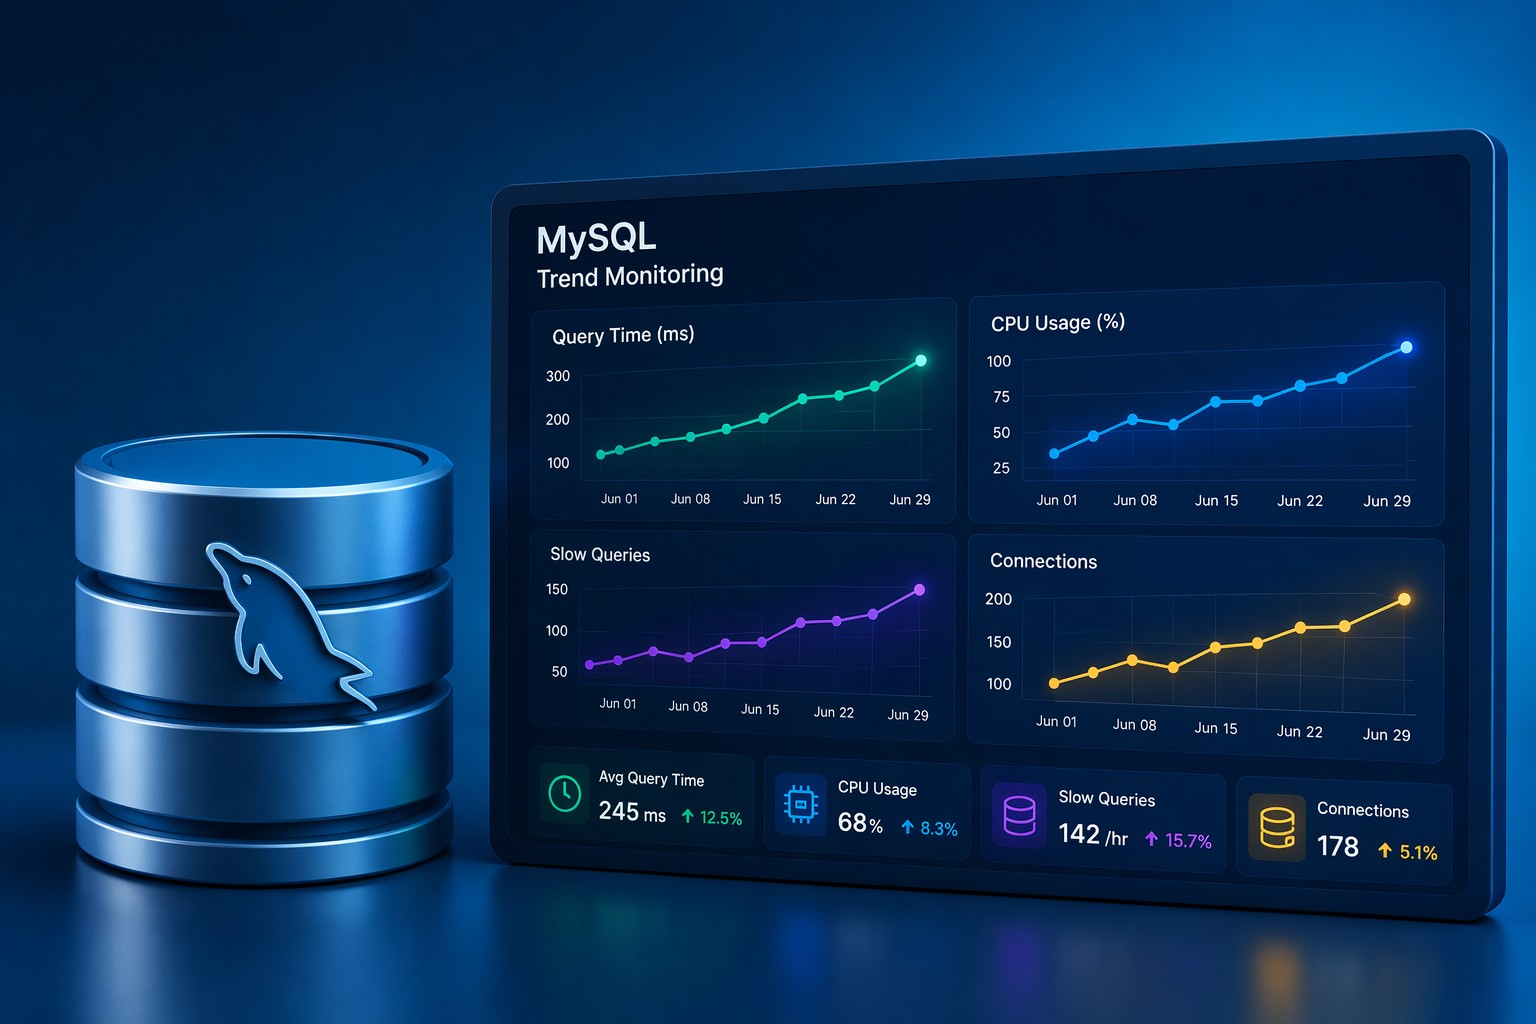
Consistent mysql slow query monitoring allows teams to identify patterns early. Instead of firefighting outages, you can see performance trends forming and take action before they escalate.
Understanding the MySQL Slow Query Log
The foundation of any mysql slow query analysis process is the slow query log. This log captures queries that exceed a defined execution time threshold.
- long_query_time: Defines what qualifies as “slow”
- log_queries_not_using_indexes: Helps detect inefficient queries
- log_output: Controls where logs are stored
Enabling and reviewing this log regularly is the first step toward identifying mysql query performance issues.
How to Detect Slow Queries in Practice
Detecting slow queries is not just about finding the worst offenders—it’s about understanding patterns.
- Look for queries that appear frequently with moderate delays
- Identify queries with growing execution times over weeks
- Track queries that suddenly spike under load
This approach turns simple detection into meaningful mysql slow query trends analysis.
Moving Beyond One-Time Analysis
Running a one-time review of slow queries can help temporarily, but it rarely solves long-term problems. Databases evolve—data grows, indexes become less effective, and workloads change.
Ongoing slow query reporting mysql processes allow you to monitor how query behavior changes over time. This is especially useful for:
- Capacity planning
- Identifying gradual regressions
- Validating optimization efforts
Real-World Example: Gradual Query Degradation
Consider a reporting query that runs every hour. Initially, it completes in 200ms. As the dataset grows, execution time increases to 800ms, then 2 seconds. Individually, these changes may not trigger alerts, but collectively they signal a growing issue.
With proper mysql slow query analysis, you would detect this upward trend early and optimize indexes or query structure before it impacts production workloads.
Common Causes of Slow Queries
- Missing or inefficient indexes
- Large table scans
- Improper joins
- Growing dataset without query adjustments
- Suboptimal schema design
Identifying the root cause is key to resolving performance bottlenecks effectively.
Practical Approach for Small Teams
Many teams don’t need complex observability stacks to manage database performance. A lightweight, trend-based approach often delivers better results.
Focus on:
- Weekly summaries of slow query activity
- Trend visualization instead of real-time noise
- Clear reporting that highlights changes over time
This aligns with how real infrastructure problems develop—gradually, not instantly.
Summary
MySQL slow query analysis is not just about identifying slow queries—it’s about understanding how performance evolves. By focusing on trends, patterns, and consistent reporting, teams can prevent issues before they impact users.
If you want a clearer view of how your database performance changes over time, explore Infrastructure Health Reporting to turn raw query data into actionable insights.