Most MySQL performance issues don’t appear suddenly.
They build slowly—query times increase slightly, CPU usage creeps up, and disk I/O becomes just a bit more expensive. Individually, none of these trigger alerts. But together, they lead to degraded performance.
That’s where mysql trend monitoring becomes essential. Instead of reacting to incidents, you start understanding how your database evolves over time.
Why MySQL Trend Monitoring Matters
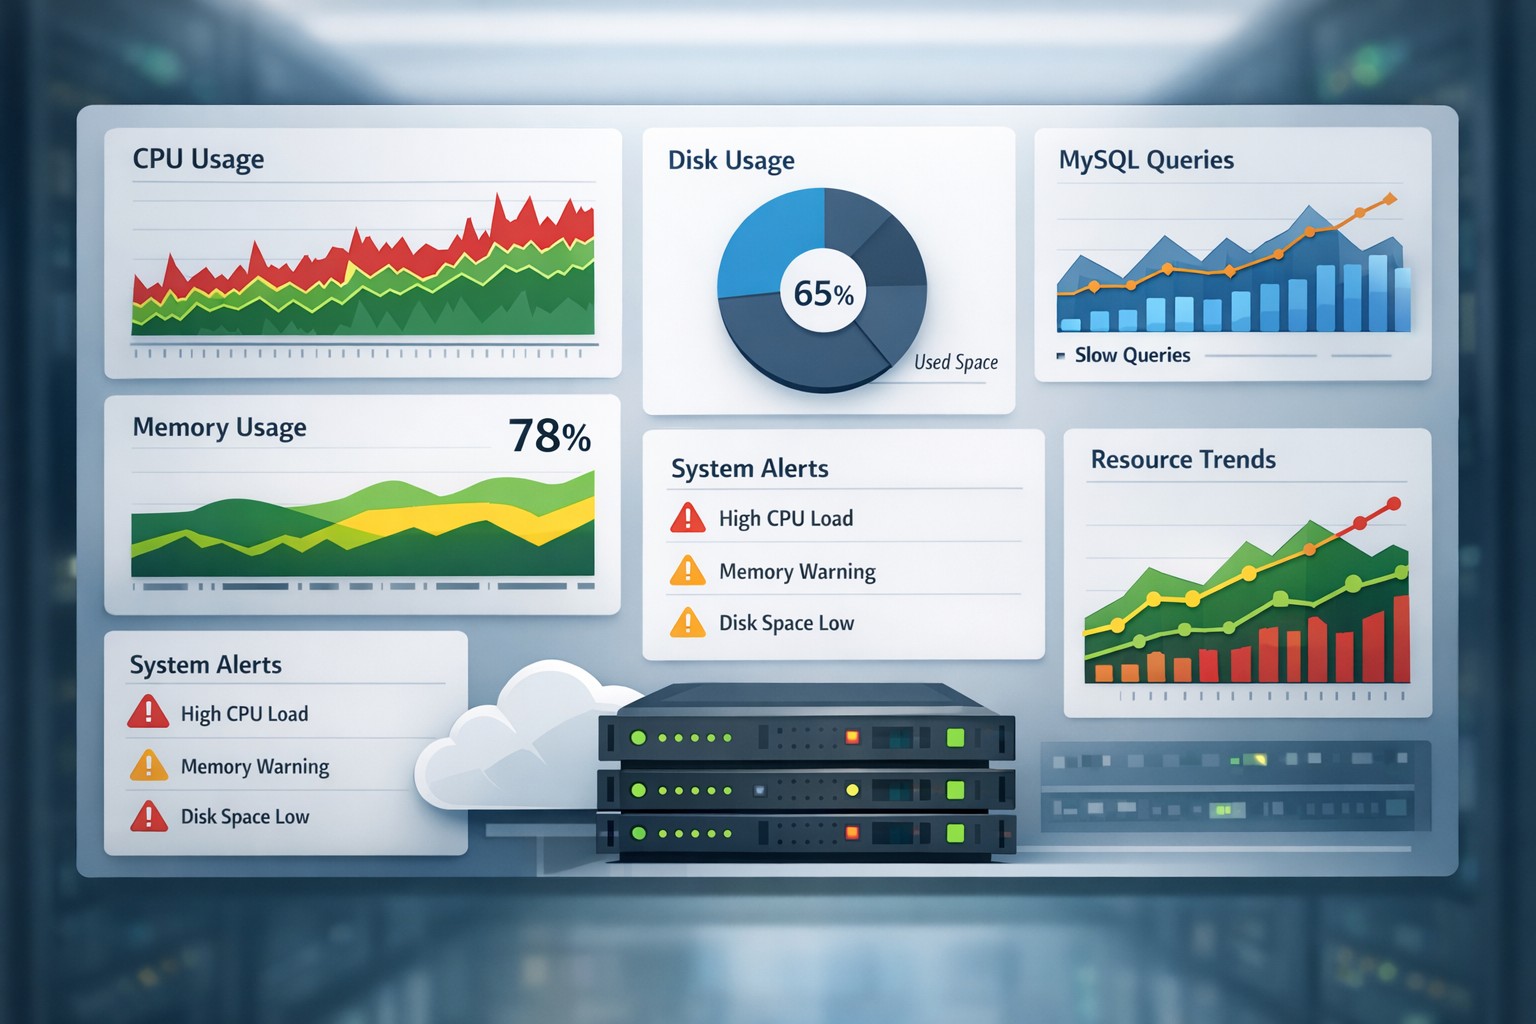
Traditional monitoring focuses on the present moment:
- Is CPU high right now?
- Is query time above threshold?
- Is the database slow?
But this approach misses the bigger picture.
MySQL performance degradation is usually gradual. Queries don’t suddenly become slow—they slowly drift in performance as data grows and workload changes.
So what does this mean in practice?
You need visibility into trends, not just snapshots.
What Trends Reveal That Alerts Miss
Here’s the thing… alerts only fire when something is already wrong.
Trends show you what’s about to go wrong.
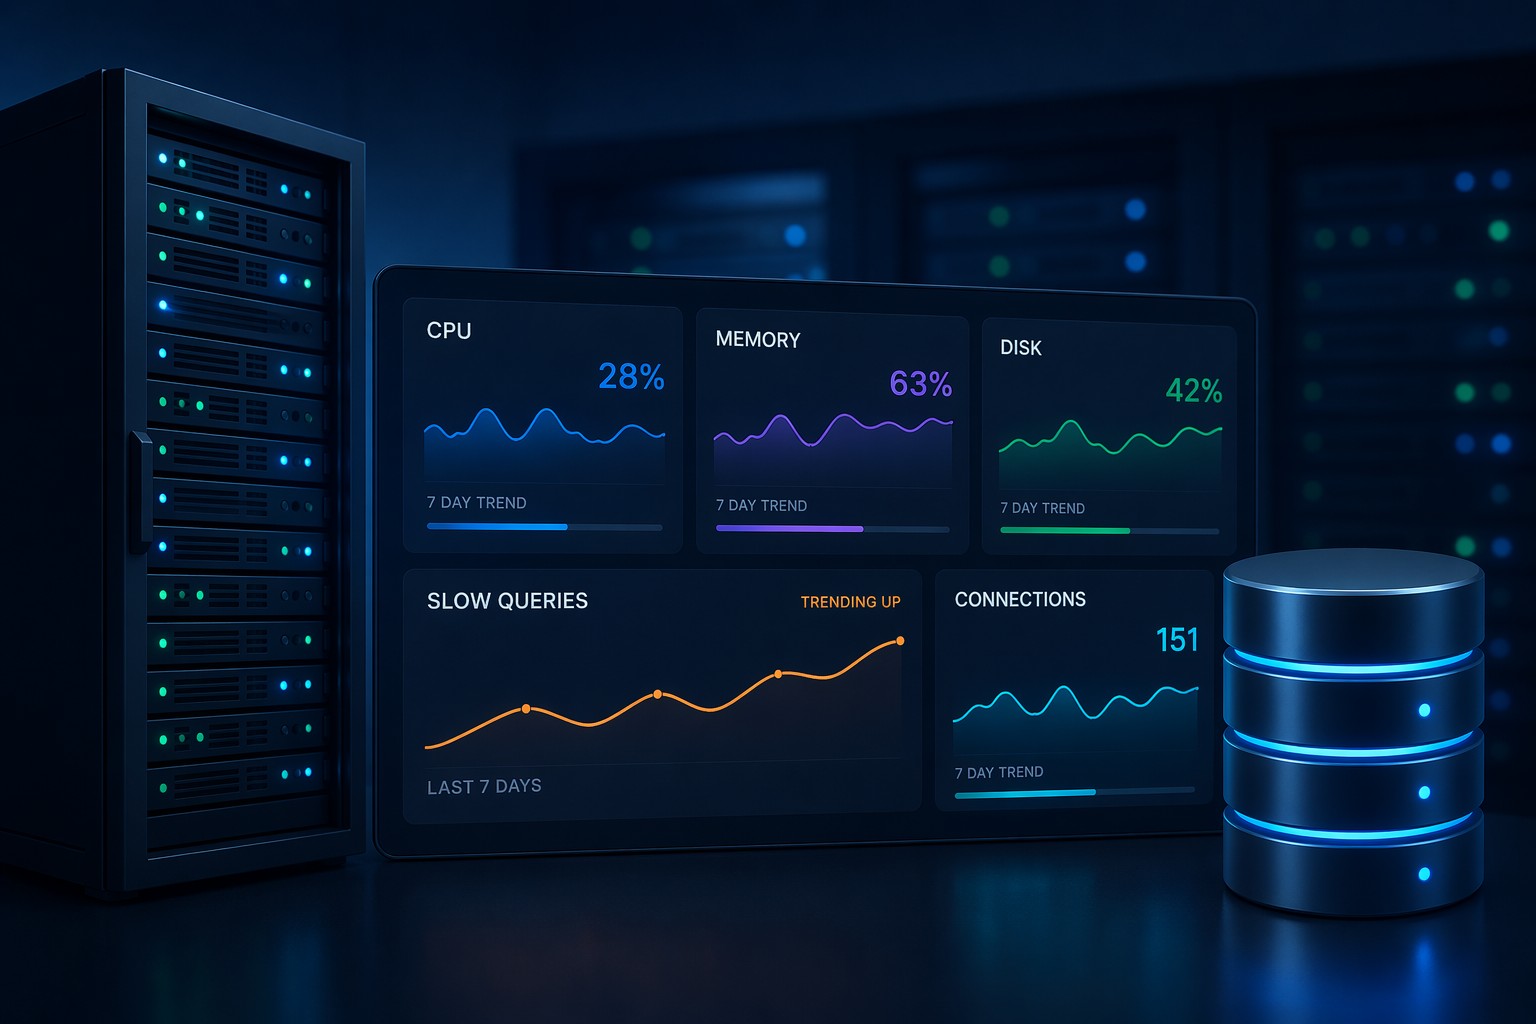
With proper mysql trend monitoring, you can identify:
- Slow query frequency increasing week over week
- CPU baseline gradually rising
- Connection counts trending upward
- Disk I/O latency slowly degrading
These are early warning signals. And they rarely trigger alerts.
Key MySQL Metrics to Track Over Time
1. Query Performance Trends
Track average execution time—not just slow queries.
Even a 5–10% increase over time can indicate:
- Missing indexes
- Growing dataset impact
- Inefficient query patterns
2. Workload Patterns
Monitor how query volume and types change.
For example:
- More read-heavy traffic over time
- Increase in complex joins
- Growing reporting queries
This helps you understand how application behavior affects MySQL performance.
3. CPU and Memory Baselines
Instead of focusing on spikes, track baseline usage.
A steady increase from 30% → 50% → 70% is far more important than a temporary spike to 90%.
4. Connection Trends
Rising connections often signal:
- Application scaling
- Poor connection pooling
- Potential bottlenecks forming
5. Disk and I/O Behavior
Disk performance rarely fails instantly.
It degrades slowly as:
- Data volume increases
- Indexes grow
- Query patterns change
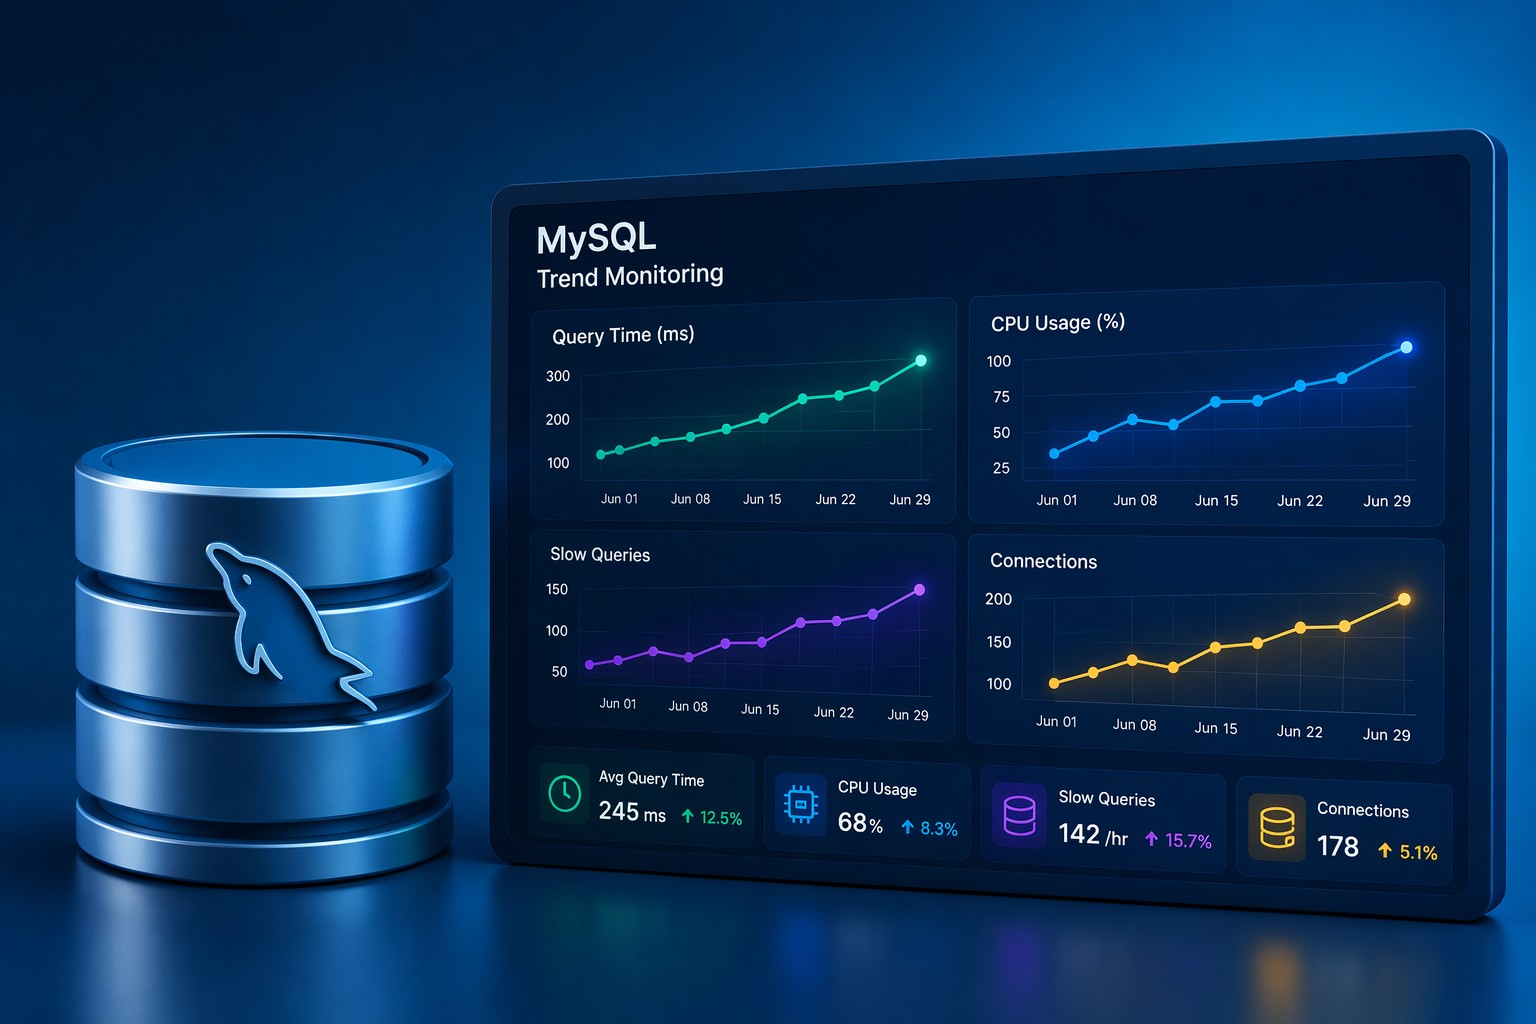
Real-World Example: Slow Degradation
Let’s say your MySQL database looks fine today:
- Average query time: 120ms
- CPU usage: 45%
- No alerts
But over 3 weeks:
- Query time increases to 180ms
- CPU baseline rises to 65%
- More slow queries appear
No single moment triggers concern.
But the trend tells a clear story: performance is degrading.
Without trend monitoring, this is invisible—until users complain.
How to Start Monitoring MySQL Trends
You don’t need a complex observability stack.
A simple approach works better for most teams:
- Collect metrics regularly (every few minutes)
- Aggregate into hourly or daily snapshots
- Review trends weekly
Focus on clarity, not volume.
But this is where it matters… consistency beats complexity.
From Reactive to Predictive Database Management
When you rely on alerts:
- You react to incidents
When you rely on trends:
- You prevent incidents
This shift is critical for small teams managing production databases without dedicated SRE resources.
Summary
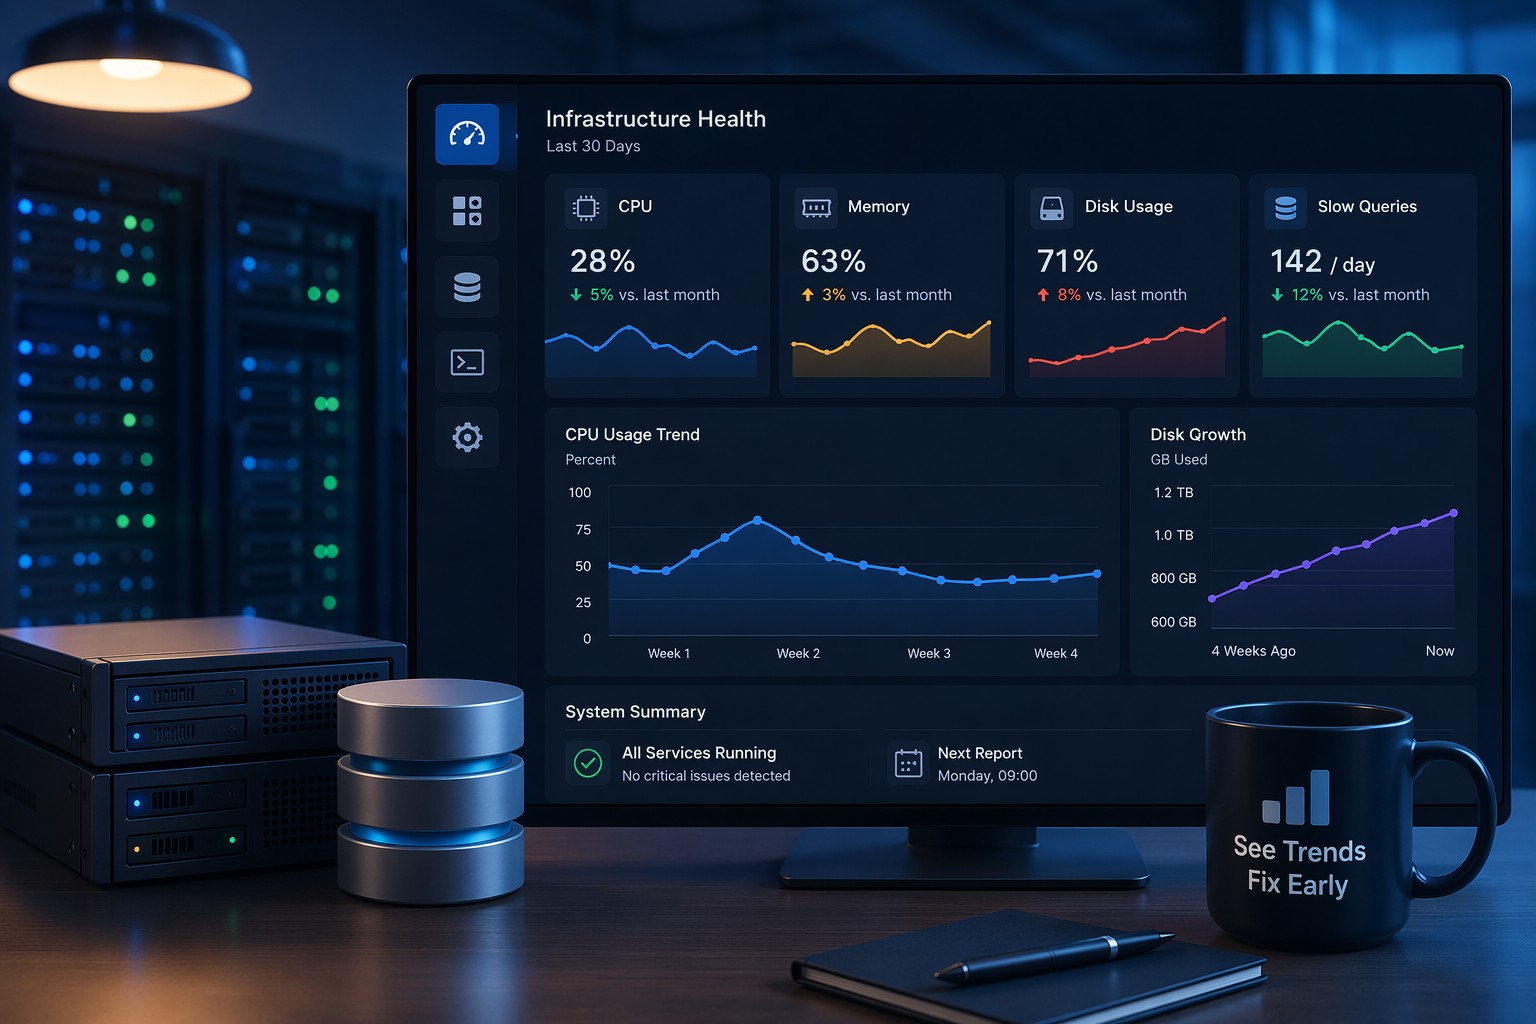
MySQL trend monitoring helps you see what’s changing—not just what’s happening.
By tracking performance trends across queries, CPU, connections, and disk behavior, you gain early visibility into issues before they impact users.
If you want a simple way to understand how your MySQL performance evolves over time, explore Infrastructure Health Reporting and start identifying problems before they become outages.