When a page starts timing out or a customer report takes twice as long as usual, it is tempting to blame the database in general. The more useful question is narrower: what changed in the workload, query plan, data volume, or server conditions that made this query slower now?
Most mysql query performance issues can be investigated with a repeatable sequence of lightweight checks. You do not need to start with a large observability platform. You need enough slow query monitoring, query analysis, and server context to separate one bad SQL pattern from broader database pressure.
Start with the symptom, not the dashboard
Before opening every metric panel, describe the symptom in plain language. Is one endpoint slow, one background report delayed, or the entire application sluggish? Did the issue start after a deployment, traffic spike, data import, index change, backup job, or server maintenance window?
This framing prevents noisy troubleshooting. A single slow admin report may point toward one query shape or missing index. Site-wide latency may point toward connection pressure, locking, I/O wait, memory pressure, or the database competing with another process on the same server.
Turn on slow query monitoring carefully
The slow query log is often the fastest path from guesswork to evidence. Enable it with a threshold that matches the workload, then review patterns instead of staring at every raw statement. On a busy server, a threshold that is too low can generate more noise than signal; on a small business system, a threshold that is too high can miss the queries that customers actually feel.
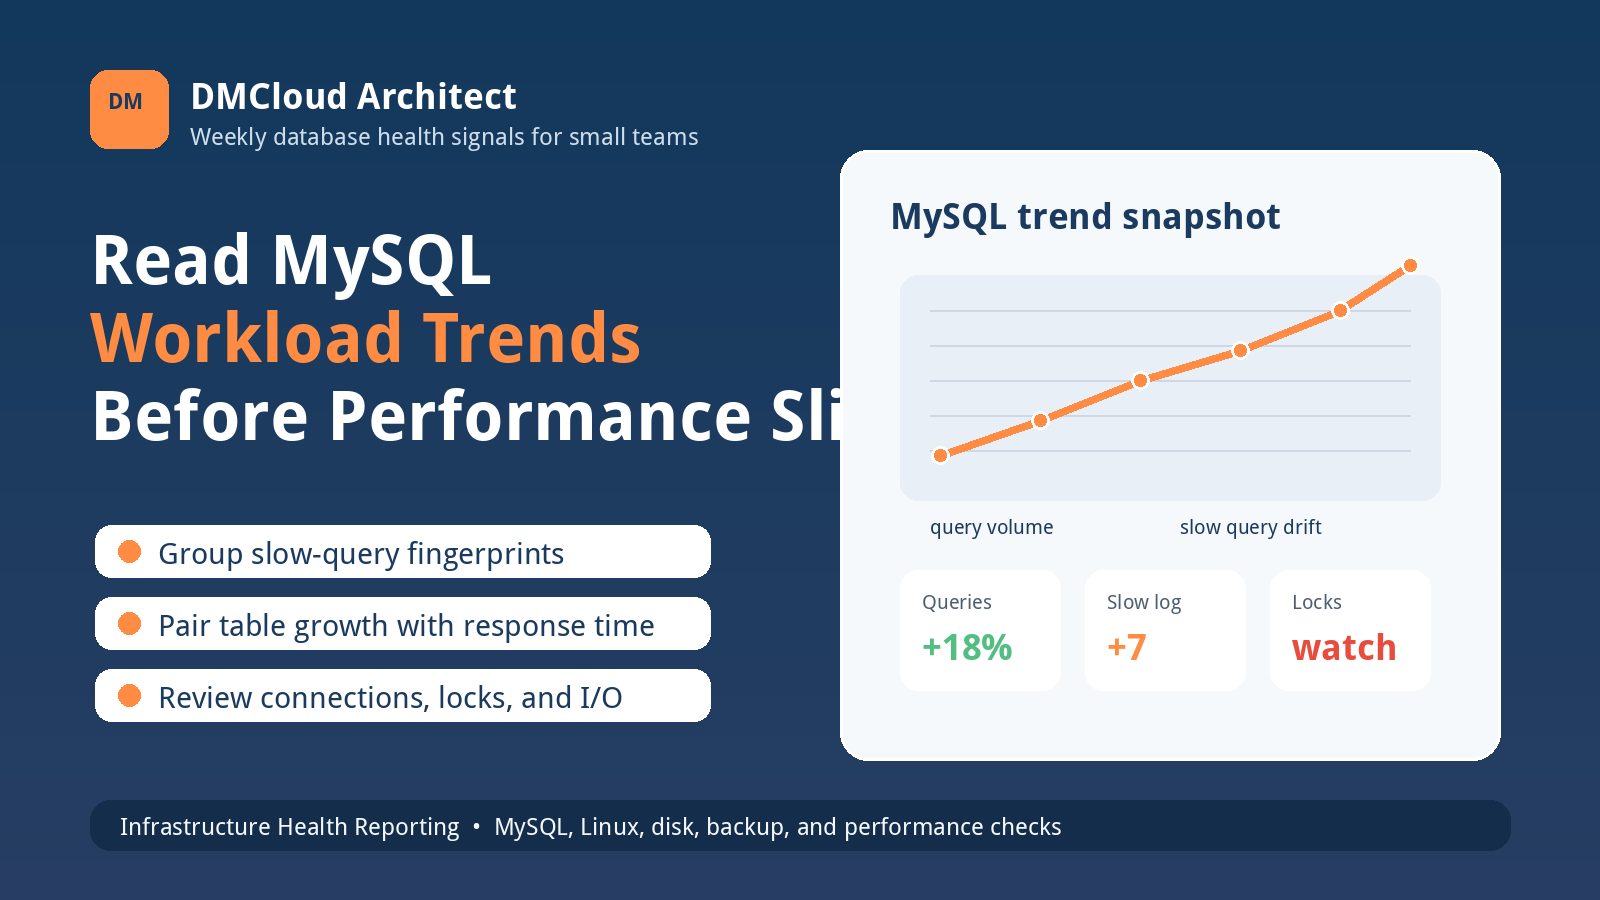
A practical weekly review asks three questions: which query fingerprints are new, which existing fingerprints are slower than last week, and which queries are happening more often? That trend view is usually more actionable than a one-time list of the ten slowest queries.
Group repeated queries before investigating one example
Slow query analysis works best when similar statements are grouped together. Ten thousand slow entries may come from one query template with different customer IDs, date ranges, or search terms. If the team treats every row as a separate incident, the real pattern stays hidden.
Choose one representative query from the repeated pattern and keep the context that matters: the tables involved, filter columns, joins, sort order, grouping, row counts, and how often the query runs. Include the endpoint, job, or report that triggered it if you can. Developers fix query performance faster when the database evidence is connected to application behavior.
Use EXPLAIN to verify the access path
After identifying a candidate query, use EXPLAIN or EXPLAIN ANALYZE where available to see how MySQL plans to read the data. Look for full table scans on large tables, poor join order, temporary tables, filesorts, missing indexes, and estimates that look wildly different from reality.
The goal is not to memorize every optimizer detail. The goal is to confirm whether MySQL can use a selective access path for the query the application is actually running. If the plan reads far more rows than expected, review indexes, predicates, data distribution, and whether the query forces MySQL to calculate or transform columns before it can filter them.
Check indexes against the real WHERE and ORDER BY
Many performance issues are described as "we need an index," but the useful question is which index supports the real access pattern. A query filtering by account, status, and date may not benefit from a single-column index on date alone. A report that filters well but sorts poorly may still spill into expensive work.
Compare the query's WHERE, JOIN, GROUP BY, and ORDER BY clauses with existing indexes. Check whether the leading columns match the most selective and most common access path. Also watch for duplicate or unused indexes; adding indexes without review can slow writes and make future maintenance harder.
Look for data growth hiding inside a familiar query
A query that was acceptable at 50,000 rows may become painful at 5 million rows. Nothing about the SQL text has to change for performance to drift. That is why mysql slow query trends matter: they show when normal business growth is quietly turning yesterday's acceptable query into tomorrow's incident.
Track table sizes, key business table growth, and the number of rows a common report scans. If a weekly health note shows a sharp rise in order rows, audit records, logs, or event data, connect that growth to the slow query patterns that touch the same tables.
Do not ignore locks, connections, and server pressure
Not every slow query is caused by a bad query plan. A statement can wait behind locks, compete for disk I/O, or run slowly because the server is under memory pressure. Pair query review with database and Linux checks: active connections, running transactions, lock waits, CPU load, memory, swap, disk latency, and recent restarts.
This is where MySQL monitoring and infrastructure monitoring should meet. If slow query entries cluster during backup windows, batch imports, or traffic spikes, the fix may involve scheduling, connection pool limits, job pacing, or server capacity rather than rewriting one query.
Separate urgent alerts from weekly reporting
Some conditions deserve immediate alerts: the database is down, connections are exhausted, replication is broken, disk is critically full, or a lock pileup is blocking production traffic. Query performance, however, often benefits from a weekly trend report as much as a pager.
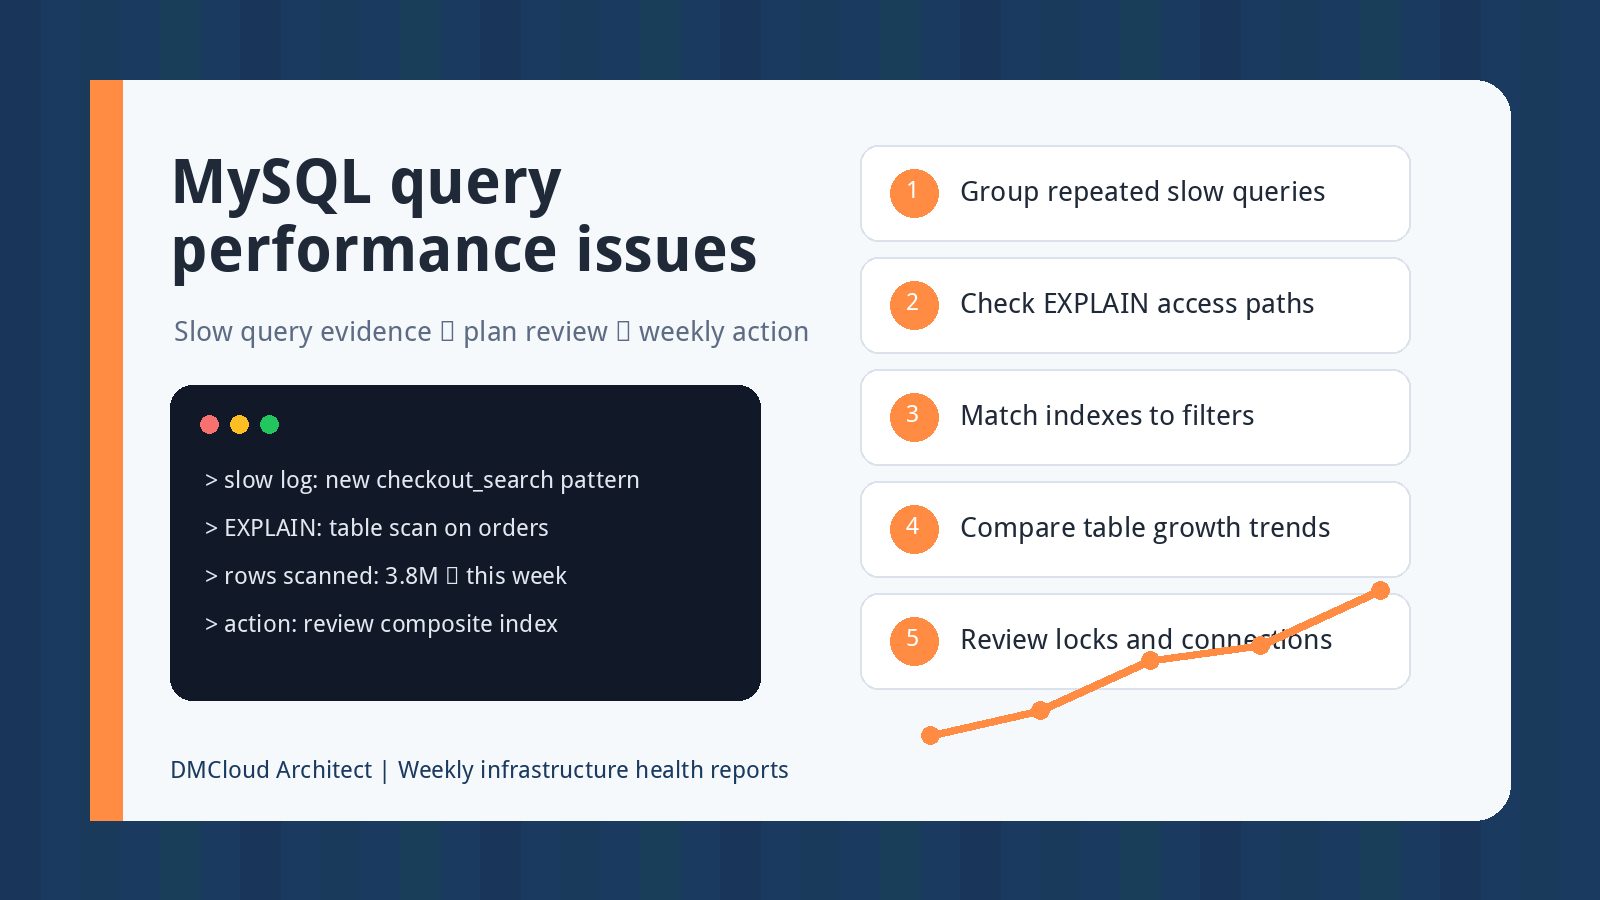
A useful slow query reporting rhythm highlights the top repeated query patterns, newly slow statements, average and worst observed time, table growth, and one recommended next action. For example: "The customer activity report scanned 3.8 million rows this week and appeared in the slow log 42 times; review composite index coverage before the next billing run."
Build a simple diagnosis checklist
When a developer asks where to start, use a small checklist: identify the affected feature, find the repeated slow query pattern, run EXPLAIN, compare indexes to filters and sorting, check table growth, review connection and lock pressure, and look for deployment or job timing changes.
This checklist keeps the conversation practical. It also creates useful history. If the same query appears in multiple weekly notes, the team can see whether the fix improved the trend or whether the workload continued growing past the original solution.
Make the output easy for non-database specialists
Developers and small business owners do not need a wall of raw SQL to understand risk. They need a short explanation of what is slow, why it probably changed, what customer or internal workflow it affects, and what action should happen next.
That translation is the difference between monitoring and useful operations. A friendly report can say, "Checkout search is slower because the query is scanning too many rows after the product catalog doubled; add or revise the account-status-date index and retest the plan." That is far easier to act on than a pasted slow log.
Want MySQL slow query trends reviewed before they become incidents?
DMCloud Architect turns MySQL, Linux, backup, disk, and performance checks into weekly infrastructure health reports for small teams that want early warnings without dashboard fatigue.
Get the free starter plan for weekly infrastructure health reports.