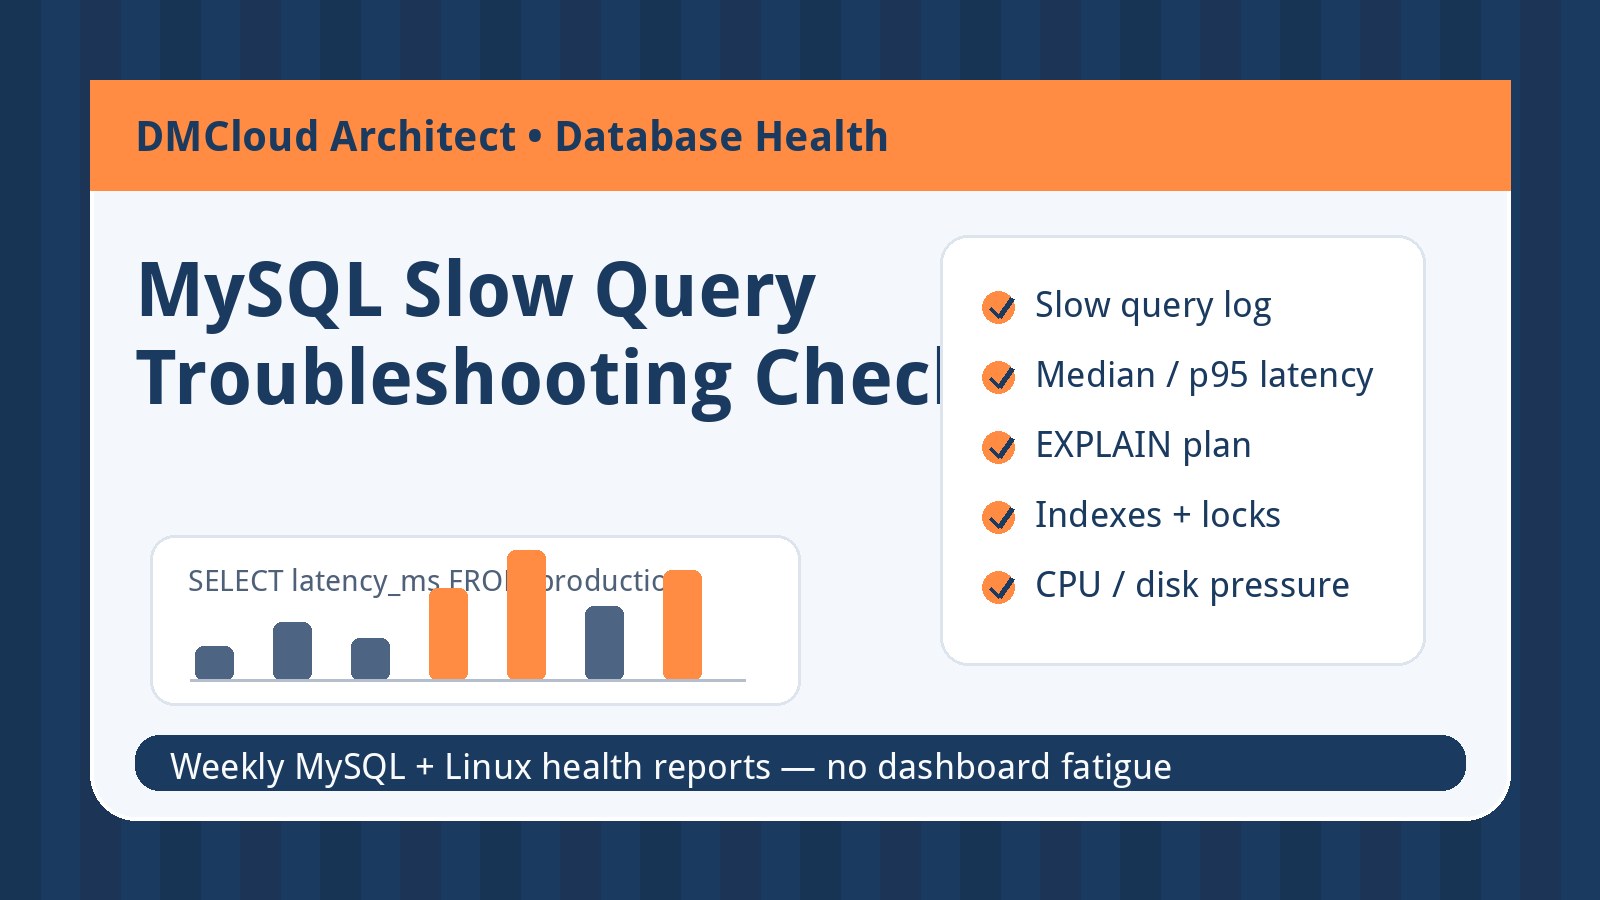
A mysql slow query investigation often starts with one frustrating question: why did this report or customer request suddenly take longer than usual? The answer is not always a broken query. It can be a missing index, a growing table, a lock wait, buffer pressure, or an average response-time report that hides the middle of the user experience.
For small business servers, the safest pattern is a checklist that connects SQL behavior with weekly infrastructure health. You do not need a full-time database team to make progress. You need enough evidence to separate one-off noise from performance drift before customers start reporting slowness.
1. Confirm the symptom before rewriting SQL
Start by defining what “slow” means for this workload. Is the issue a single admin report, a public checkout page, a background job, or every request that touches MySQL? A query that is fine once per hour can become painful when it runs for every page view.
- Record the endpoint or job name: connect the query to the business action people notice.
- Capture timing: note typical, current, and worst-case runtimes if available.
- Check frequency: a two-second query that runs thousands of times may matter more than a ten-second monthly report.
- Look for timing patterns: compare business hours, backup windows, imports, billing jobs, and reporting runs.
This prevents the common trap of optimizing a visible query while the real bottleneck is connection pressure, disk I/O, or a scheduled task that changed the workload.
2. Turn on the slow query log with practical thresholds
The MySQL slow query log gives you a factual starting point. For production, keep the threshold practical and adjust it to the application. A busy storefront may need a lower threshold than a small internal reporting tool. The goal is not to collect every statement; it is to identify queries that regularly consume time or resources.
- Enable slow query logging carefully: confirm log location, rotation, and disk impact.
- Start with a reasonable long_query_time: then lower it if the log is too quiet to explain real symptoms.
- Include queries not using indexes: useful during review, but noisy on some systems.
- Summarize repeated fingerprints: group similar statements rather than chasing every literal value.
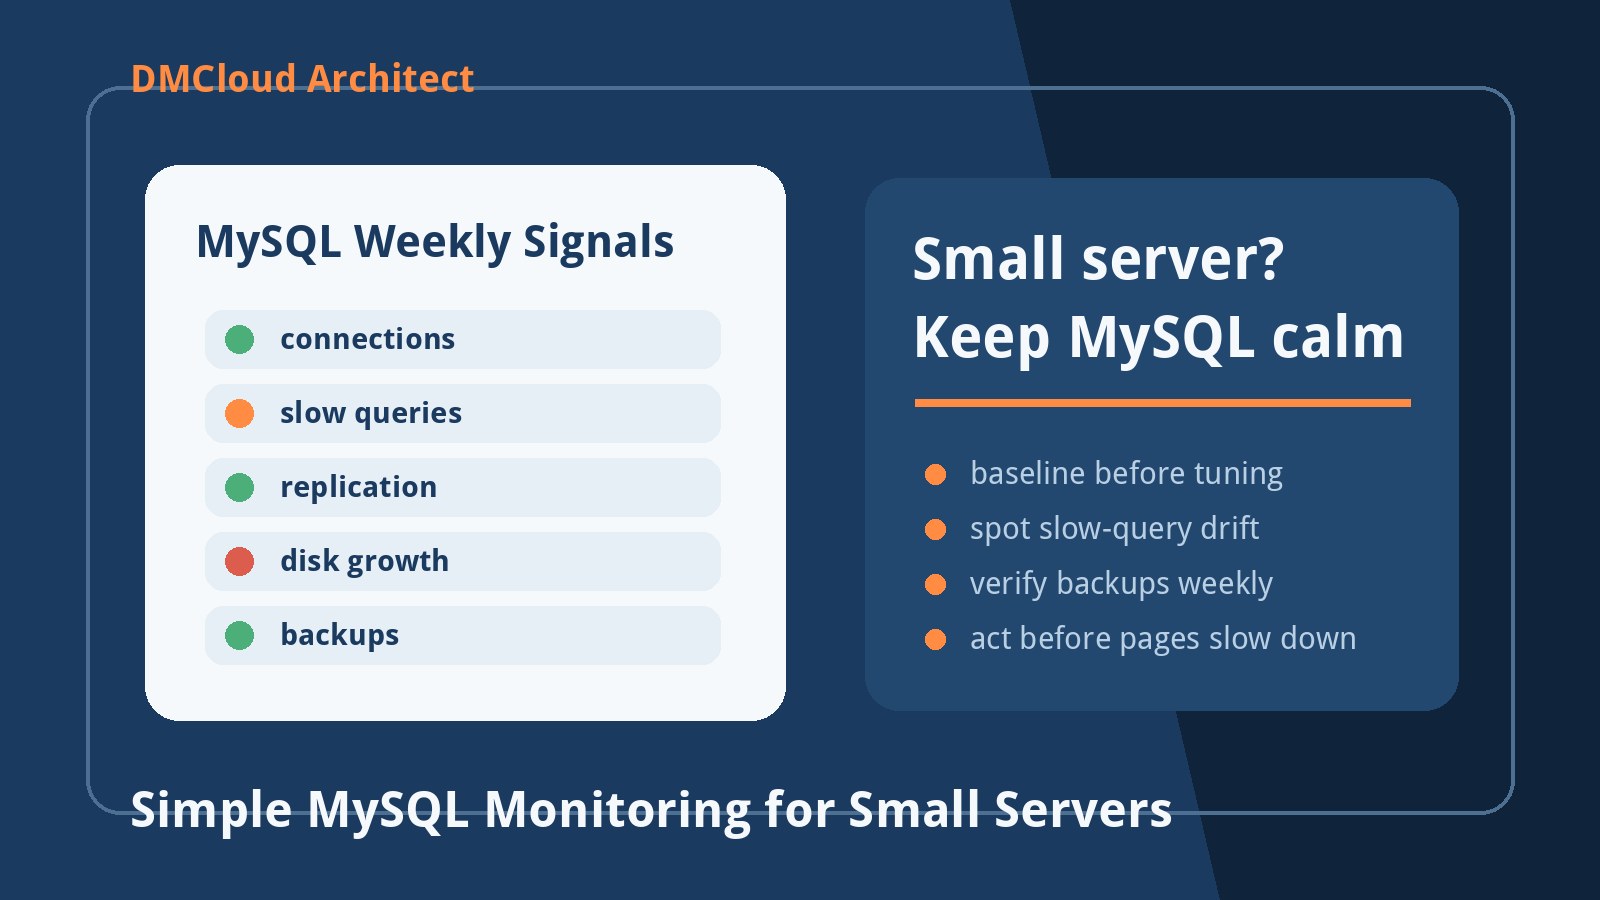
For weekly health reporting, the useful output is a short list: top slow query patterns, count, total time, worst observed time, and whether each pattern is new, growing, or stable.
3. Do not rely on averages alone
Averages can hide the experience that users actually feel. Ten fast requests and one very slow request can produce an average that looks acceptable while one customer is staring at a spinner. This is why teams often ask for median or percentile numbers when reviewing database latency.
MySQL may not give every statistical aggregate as a simple built-in function in every version or context, but the operational lesson is straightforward: compare the shape of latency, not only the average. If you cannot calculate a perfect median inside the database, calculate it in your reporting layer or use sampled timing from application logs.
- Average: useful for broad direction, but sensitive to outliers.
- Median: shows the typical request and helps filter rare spikes.
- 95th percentile: shows what slower users may experience during pressure.
- Maximum: useful for incident clues, but not enough by itself.
A weekly report that says “average query time is fine” is weaker than one that says “median is stable, but the 95th percentile doubled after the import job changed.”
4. Inspect execution plans before adding hardware
Use EXPLAIN or EXPLAIN ANALYZE where appropriate to see how MySQL plans to find rows. A server upgrade can mask poor query shape for a while, but it will not fix an unbounded scan on a table that keeps growing.
- Check access type: full table scans on large or growing tables deserve attention.
- Review possible_keys and key: confirm MySQL can use the index you expect.
- Watch rows examined: a small result set can still be expensive if MySQL examines too many rows.
- Review sorting and temporary tables: large
ORDER BY,GROUP BY, or reporting queries can spill into expensive work.
When a slow query belongs to a business-critical path, save the plan with the query fingerprint. That makes future changes easier to review instead of relying on memory.
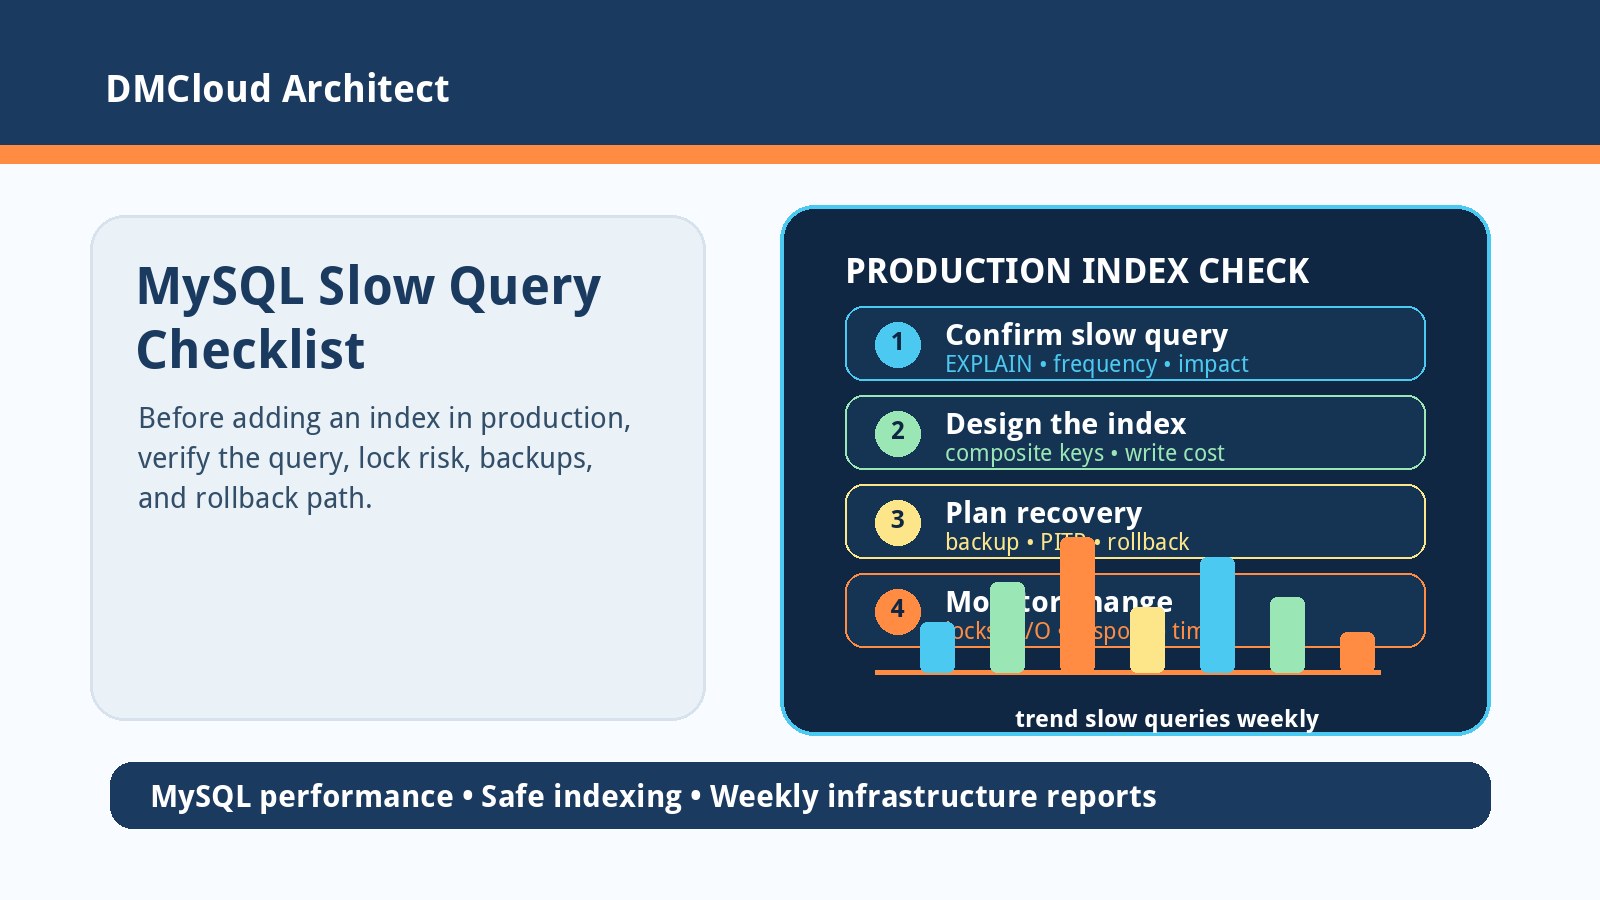
5. Check indexes against the real WHERE and JOIN pattern
Indexing should follow the way the application actually asks for data. Adding random indexes can slow writes, increase disk use, and still miss the slow path. Review the columns used in WHERE, JOIN, ORDER BY, and common date filters.
- Prioritize repeated slow patterns: not every slow one-off report deserves a schema change.
- Match composite indexes to query order: especially for tenant, status, and date-range filters.
- Remove unused index guesses carefully: only after checking application and reporting needs.
- Measure after change: confirm rows examined, runtime, and write impact improved.
For small teams, the best index change is one tied to an observed query pattern, a saved before-and-after plan, and a rollback note.
6. Separate query cost from server pressure
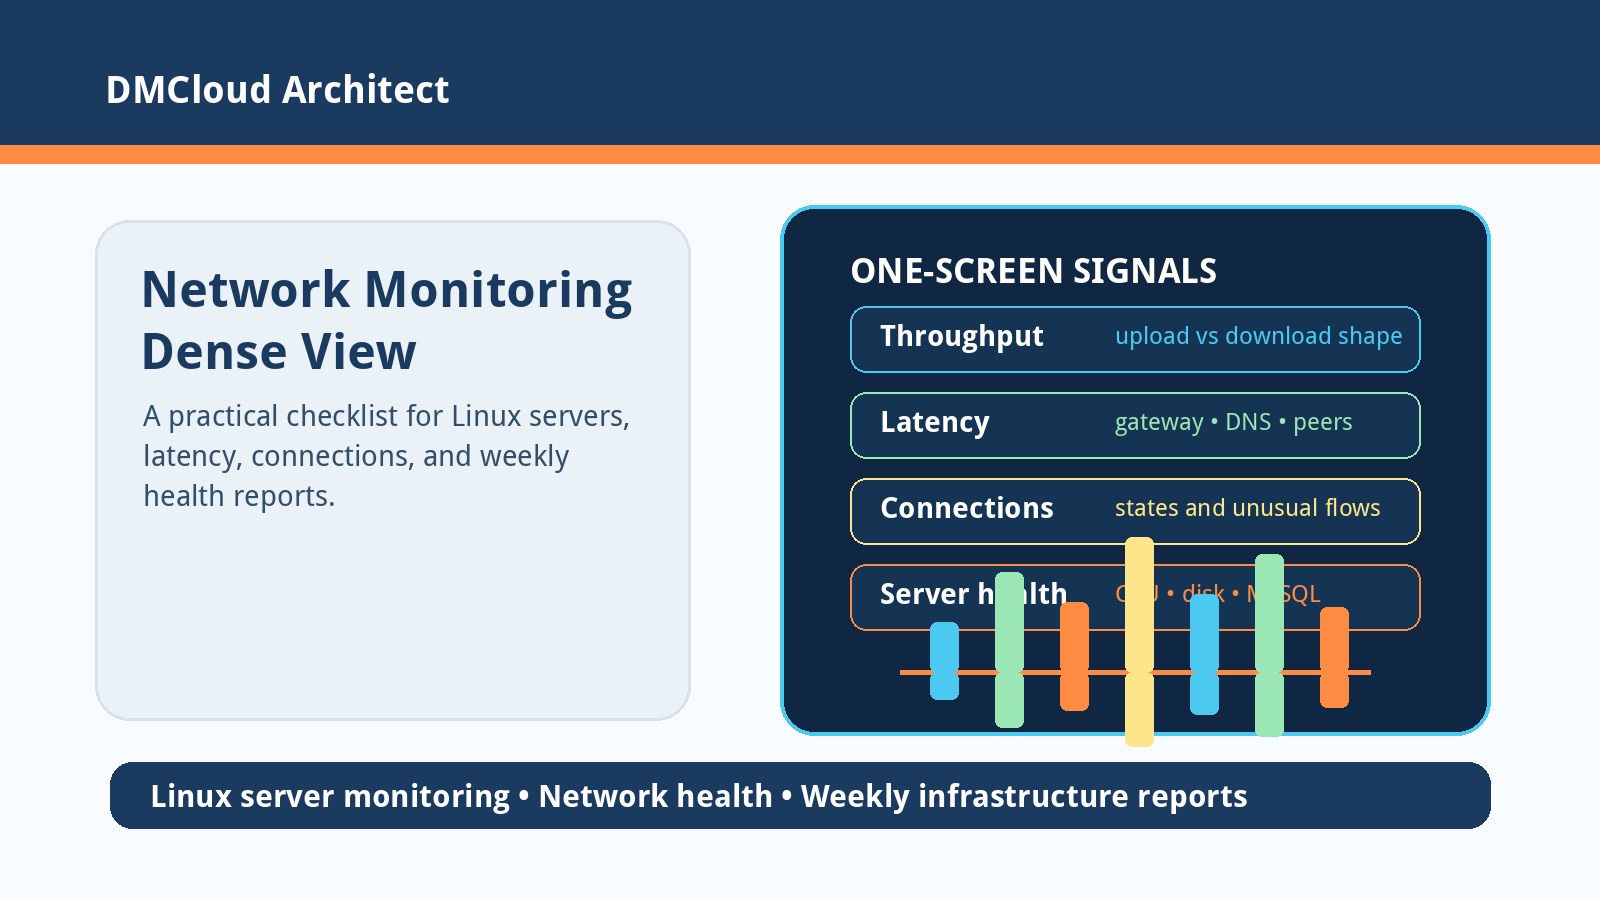
A query can look slow because the SQL is inefficient, or because the server is under pressure. Before rewriting a major report, compare MySQL symptoms with Linux health signals.
- CPU: sustained load, steal time on VPS hosts, and spikes during reporting jobs.
- Memory: swap use, buffer pool pressure, and out-of-memory events.
- Disk: I/O wait, slow storage, free-space growth, and backup contention.
- Connections: max connection pressure, thread growth, and connection storms from application retries.
- Locks: long transactions, metadata locks, and write-heavy tasks blocking reads.
This is where infrastructure health reporting earns its keep. If the database is slow every Monday during backups, the query may be only one part of the story.
7. Review table growth and statistics
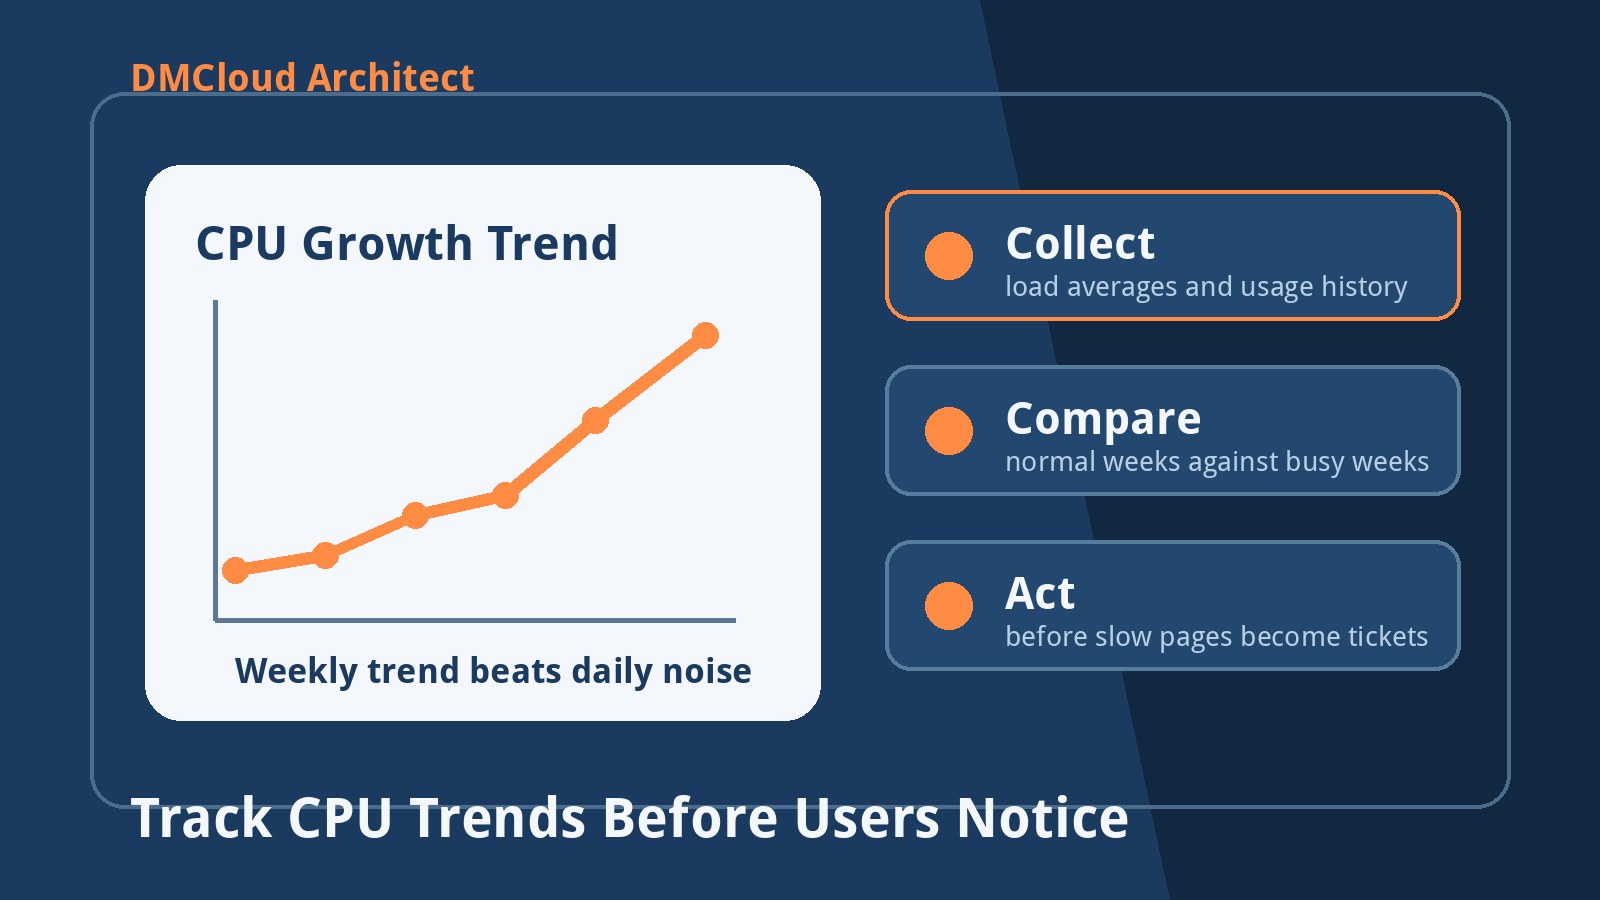
Queries that were fast last quarter can degrade as tables grow. A date-range report, customer lookup, or order search may cross a threshold where the old plan is no longer good enough. Track table sizes, row counts, and growth rate alongside slow query trends.
- Identify fast-growing tables: logs, sessions, audit trails, orders, and event tables often grow quietly.
- Check retention: archive or purge old operational data when the business no longer needs it online.
- Refresh statistics where appropriate: stale estimates can lead to poor plans.
- Plan partitions carefully: useful for some large time-series tables, but not a substitute for good query design.
Growth trend is the difference between “the site got slow” and “this table has doubled in eight weeks and the report plan changed.”
8. Convert findings into a short weekly action list
A slow-query review should end with decisions, not a folder full of logs. Keep the weekly output simple enough that a developer or business owner can act on it:
- New slow query patterns: what appeared this week that was not present before?
- Worsening patterns: which fingerprints are increasing in count, total time, or 95th percentile latency?
- Likely cause: missing index, table growth, lock wait, resource pressure, backup overlap, or application retry behavior.
- Next action: one owner, one recommended check, and one expected outcome.
This keeps MySQL performance work calm and measurable. It also reduces alert fatigue because the report explains priority rather than dumping every warning into a chat channel.
Use this checklist before the next customer-visible slowdown
MySQL troubleshooting gets easier when slow query evidence, latency distribution, execution plans, and server health are reviewed together. The practical goal is not to make every query perfect. It is to find drift early, fix the highest-value bottlenecks first, and give small teams a clear weekly view of database risk.
Want weekly infrastructure health checks without dashboard fatigue?
DMCloud Architect sends Linux and MySQL infrastructure health reports directly to your inbox, so you can spot query, disk, CPU, memory, and database risks before they become user-facing incidents.
Get the free starter plan for weekly infrastructure health reports.