A high-severity vulnerability in a hosting control panel can make even a quiet server feel urgent. The risk is not only the published CVSS score or the exploit path; it is the possibility that an internet-facing management plane becomes a root-level path into the machine that holds customer sites, mail, databases, and backups. For developers and small business owners, the right response is calm, documented, and evidence-driven.
This checklist is written for teams running Plesk or similar Linux hosting panels who need a practical linux server monitoring workflow after an XML API privilege escalation advisory. It does not replace the vendor advisory or your change-control process. It gives you a repeatable order: confirm exposure, patch safely, review access, check for suspicious changes, and keep monitoring after the maintenance window closes.
Start by confirming whether the server is exposed
Before changing anything, identify which systems are actually in scope. A vulnerability in a control panel API matters most when that API is reachable by users, automation, integrations, or the public internet. Small teams often lose time because they treat every Linux host the same instead of separating exposed Plesk nodes from unrelated servers.
- Inventory Plesk hosts: list production, staging, lab, and legacy control panel servers.
- Record versions: capture the installed Plesk version, extension versions, operating system release, and kernel version.
- Map API exposure: verify whether the XML API endpoint is reachable from the internet, private networks, VPNs, CI systems, billing tools, or reseller/customer integrations.
- Check authentication paths: note which users, service accounts, API keys, and automation jobs can authenticate.
- Save evidence: keep command output, timestamps, and screenshots with the incident or maintenance ticket.
The point is to avoid a vague statement like “we use Plesk somewhere.” A useful response starts with “these three hosts are exposed, this one is internal only, and these two legacy hosts are no longer serving customer traffic.”
Patch, but do not skip the before-and-after checks
Applying vendor guidance should be the priority, especially for internet-facing management services. But patching without a baseline can leave you unable to prove what changed. Before the update, capture enough state to validate that the server returned to normal and that you did not miss a second issue such as low disk, failed services, or disabled backups.
- Confirm backup recency and restore location before touching the control panel.
- Record current Plesk version, pending updates, service status, disk usage, and load average.
- Apply the vendor-recommended update or mitigation through the safest supported channel.
- Restart only the services required by the update, then verify panel login, customer sites, mail, DNS, and scheduled tasks.
- Record the patched version and any failed update output in the same ticket.
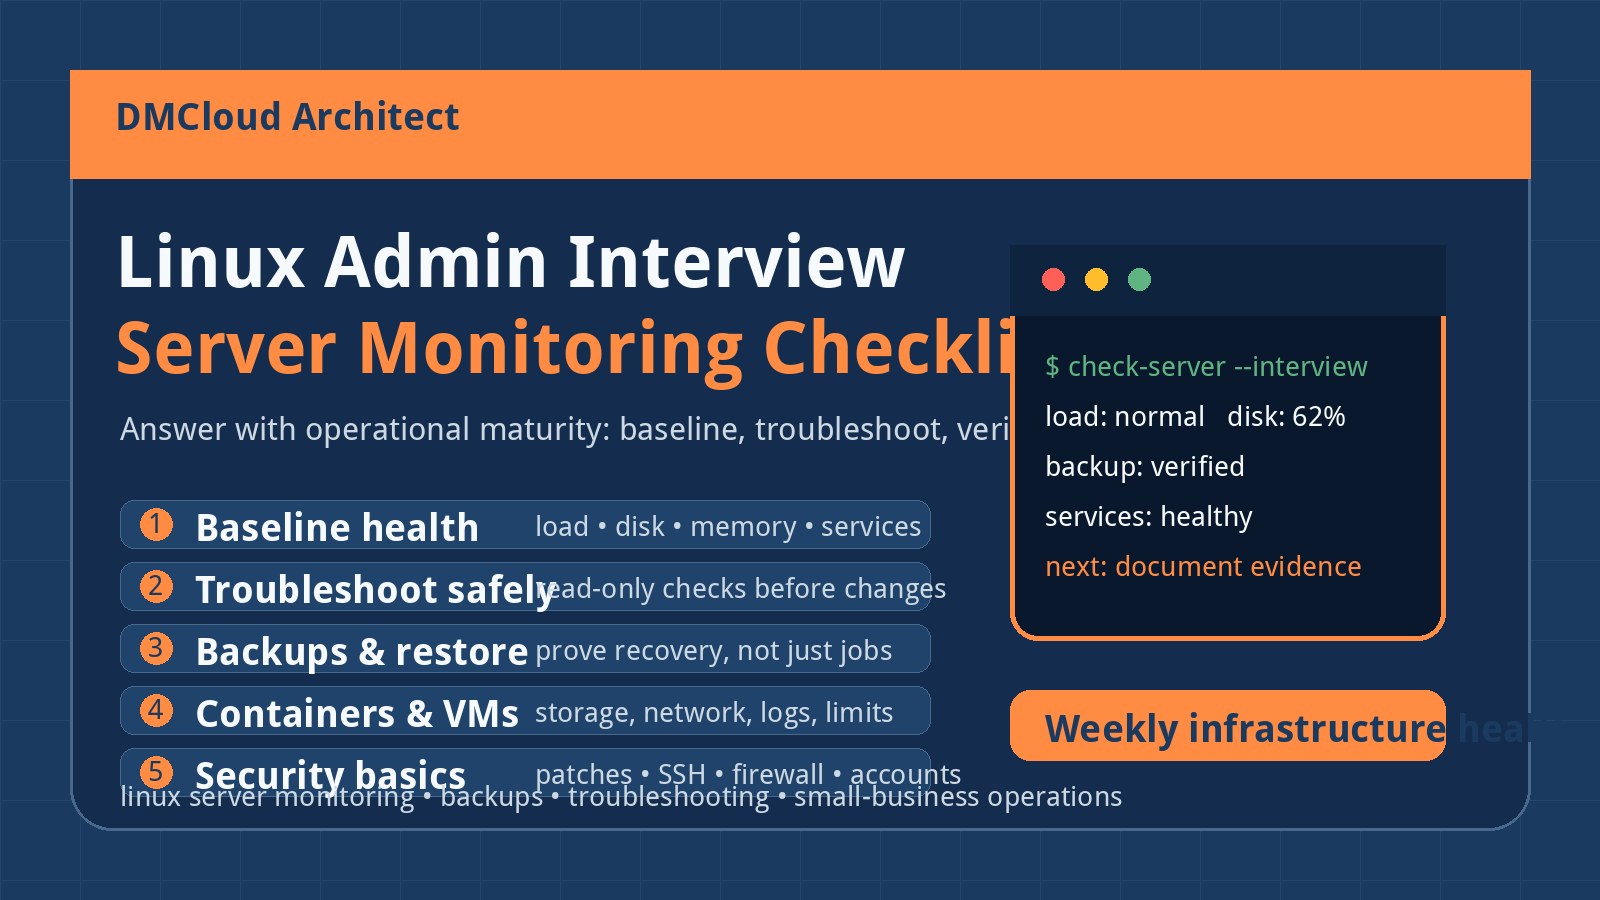
For small businesses, this is where lightweight monitoring earns its keep. A weekly or daily health report that already tracks disk pressure, service failures, package updates, and backup status makes an urgent security maintenance window far less chaotic.
Review privileged access and API accounts
An authenticated privilege escalation risk makes access review part of the technical fix. Even if the patch is applied quickly, you should ask whether too many users or integrations had the ability to reach the vulnerable path. Start with accounts that can authenticate to the panel, API, SSH, and related automation.
- Disable stale users: remove former employees, expired contractors, old reseller accounts, and forgotten test accounts.
- Rotate risky credentials: prioritize API tokens, automation passwords, and accounts shared across tools.
- Limit source networks: restrict management and API access to VPNs, office IPs, jump hosts, or trusted automation networks when possible.
- Separate humans from automation: service accounts should have clear owners, narrow scope, and documented use.
- Review sudo/root paths: confirm that panel-related users and scripts do not create unnecessary shell-level privilege.
This does not have to become a month-long identity project. The practical goal is to reduce the number of authenticated paths that could turn an application-layer bug into root-level control.
Look for evidence of arbitrary file writes
The advisory’s most worrying phrase is often “arbitrary file write as root.” That changes your monitoring checklist. You are no longer only checking whether the package version is fixed; you are checking whether configuration files, web roots, cron jobs, SSH keys, startup scripts, and panel-managed files changed unexpectedly around the exposure window.
- Recent file changes: review sensitive directories such as
/etc, web roots, cron locations, systemd unit paths, and panel configuration directories for unexpected modification times. - New scheduled jobs: inspect root and service-user cron entries, systemd timers, and automation hooks.
- Unexpected accounts or keys: check for new users, changed sudoers entries, and newly added SSH authorized keys.
- Web artifacts: look for suspicious PHP files, unfamiliar uploads, modified index files, or files with names designed to blend in.
- Logs around authentication: correlate panel logins, API calls, web server access, SSH sessions, and package/update timestamps.
If you have file integrity monitoring, this step is much easier. If you do not, create a small manual evidence checklist now and consider adding integrity and change-summary reporting before the next advisory forces the issue.
Monitor service health after the fix
A patched server can still be unhealthy. Security maintenance may restart services, fill disks with logs, expose old dependency problems, or reveal that backups were not actually completing. The next 24 to 72 hours matter because customer-facing issues often appear after the urgent change is marked done.
- Control panel availability: verify the panel responds and that expected admins can log in.
- Website checks: test a representative sample of hosted sites, including HTTPS and database-backed pages.
- Mail and DNS: confirm queue health, DNS service state, and any panel-managed zones.
- Resource trends: watch load average, memory pressure, disk growth, and error logs after the update.
- Backup follow-up: confirm that the next scheduled backup runs successfully after patching.
This is where linux server monitoring should connect security response to ordinary operations. The same report that flags a CVE follow-up should also tell you whether the server is stable, backed up, and still serving customers normally.
Document the decision when you cannot patch immediately
Sometimes a production server cannot be patched the moment an advisory appears. That does not mean “do nothing.” If you need a maintenance window, document the temporary controls and make sure someone owns the follow-up.
- Restrict panel and API access to trusted networks while waiting for the window.
- Disable unused API integrations and stale accounts.
- Increase log review frequency for panel authentication, API calls, and suspicious file changes.
- Notify affected stakeholders of the planned maintenance window and expected impact.
- Set a deadline for the patch and a second deadline for post-patch verification.
A written exception is not bureaucracy. It prevents an urgent risk from becoming a forgotten tab in someone’s browser.
Turn the advisory into a reusable checklist
After the incident, keep the parts that worked. Save the exposure inventory, commands, patch notes, account review steps, and monitoring checks as a short runbook. The next control panel advisory, OpenSSL issue, database CVE, or Linux privilege escalation should not start from a blank page.
A good recurring health report should answer simple questions: are management services exposed, are critical packages current, are backups fresh, are disks growing unexpectedly, did privileged files change, and are failed services being noticed? Those basics will not eliminate every vulnerability, but they shorten the time between “new advisory” and “we know what to do.”
The takeaway is straightforward: treat security advisories as operational events, not just patch notes. Patch quickly, verify carefully, reduce exposed access, and keep the evidence visible after the urgency fades.
Want weekly infrastructure health checks without dashboard fatigue?
DMCloud Architect sends Linux and MySQL infrastructure health reports directly to your inbox, so you can spot risks early without adding another monitoring dashboard to watch.
Get the free starter plan for weekly infrastructure health reports.