CPU problems rarely arrive as a single dramatic event. More often, a server gets a little busier each week, a backup window grows longer, a report query becomes more expensive, or a noisy process starts stealing headroom during business hours. Simple CPU monitoring on Linux gives you enough visibility to notice those patterns before customers experience slow pages, timeouts, or stuck jobs.
The goal is not to replace a full monitoring platform. The goal is to build a practical baseline that a developer, founder, or small-business IT owner can review quickly. If the weekly numbers look calm, you move on. If they drift, you have evidence for the next troubleshooting step.
Start with the CPU questions that matter
Before writing a script, decide what you want the check to answer. A useful lightweight CPU review should tell you whether the machine is consistently busy, whether short spikes are becoming common, whether one process is dominating the server, and whether virtualization pressure is involved. Those answers are more useful than a single raw percentage with no context.
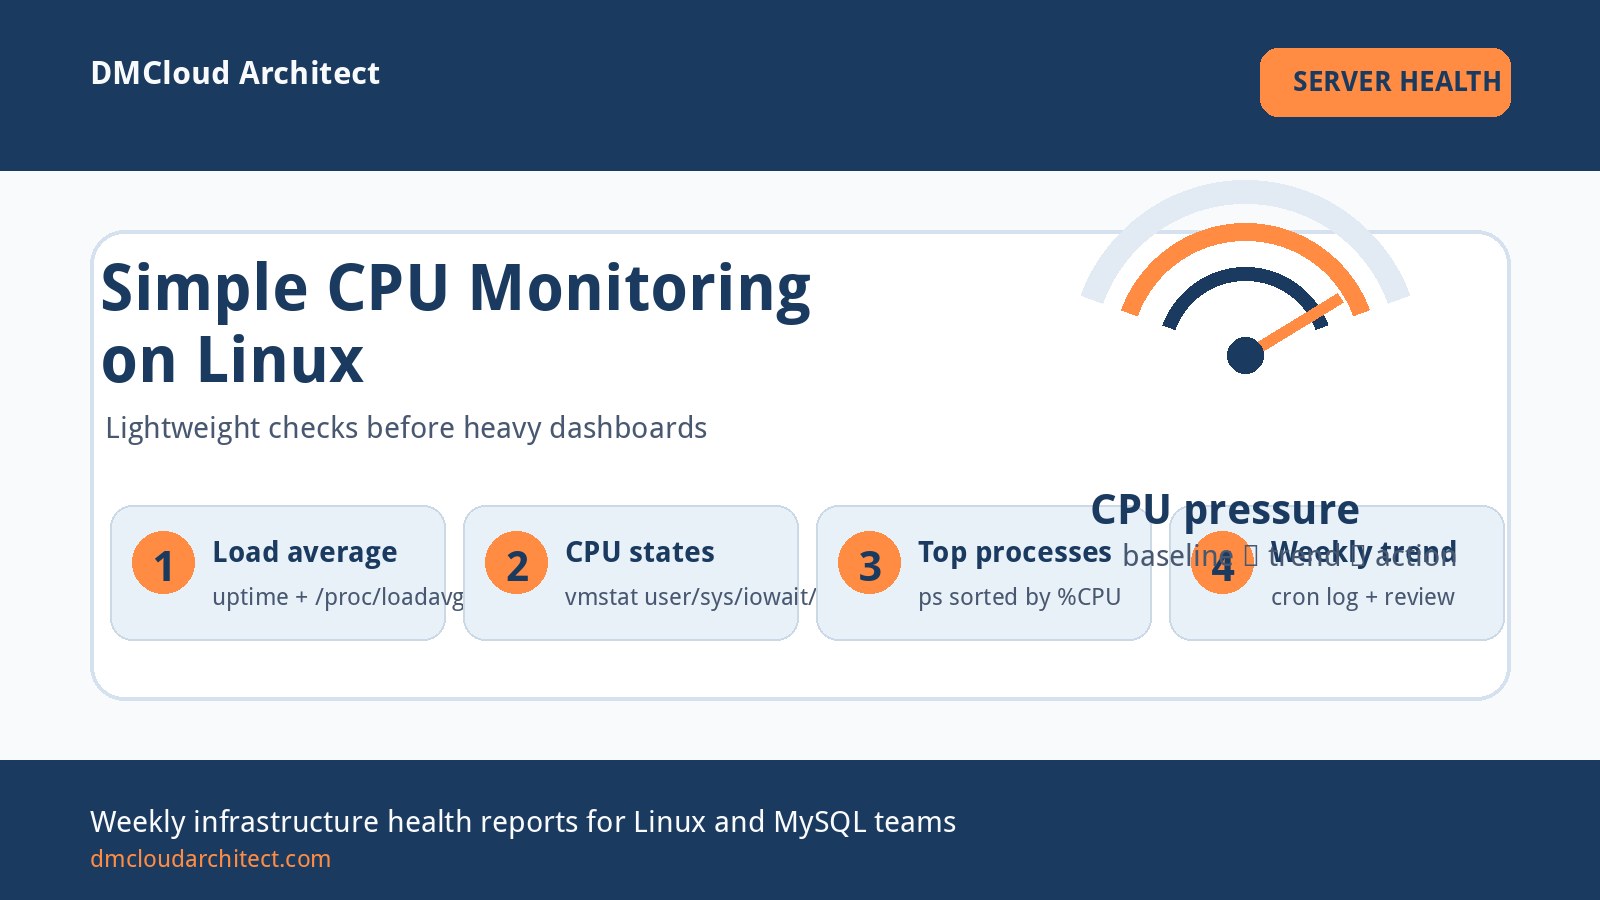
For most small Linux servers, begin with four signals:
- Load average: whether runnable work is piling up over 1, 5, and 15 minutes.
- CPU utilization: user, system, idle, iowait, and steal time.
- Top processes: the commands using the most CPU at the time of the sample.
- Trend direction: whether the weekly baseline is flat, rising, or suddenly uneven.
Use built-in Linux commands first
You can monitor CPU usage on Linux without installing a heavy stack. The commands below are available on many distributions or can be added with standard system packages:
uptime
nproc
vmstat 1 5
ps -eo pid,ppid,comm,%cpu,%mem --sort=-%cpu | head -10
uptime shows load average. nproc tells you how many CPU cores are available, which helps you interpret load. vmstat gives a compact view of CPU states, runnable processes, blocked processes, and I/O wait. ps gives you a quick list of the processes competing for CPU right now.
A load average of 4 can be comfortable on an 8-core server and alarming on a 2-core server. That is why your script should capture both the load and the core count. The relationship between the two matters more than the load number by itself.
Create a small Bash CPU monitoring script
A simple Bash CPU monitoring script can collect a timestamped snapshot and append it to a log file. Keep the first version boring and readable:
#!/usr/bin/env bash
set -euo pipefail

OUT="/var/log/simple-cpu-monitor.log"
TS="$(date -Is)"
HOST="$(hostname -f 2>/dev/null || hostname)"
CORES="$(nproc)"
LOAD="$(awk '{print $1, $2, $3}' /proc/loadavg)"

{
  echo "--- ${TS} host=${HOST} cores=${CORES} load=${LOAD} ---"
  vmstat 1 5 | tail -1
  ps -eo pid,comm,%cpu,%mem --sort=-%cpu | head -8
  echo
} >> "${OUT}"
Run it manually first and confirm the file is created:
sudo install -m 0755 simple-cpu-monitor.sh /usr/local/sbin/simple-cpu-monitor
sudo /usr/local/sbin/simple-cpu-monitor
sudo tail -40 /var/log/simple-cpu-monitor.log
This is intentionally modest. It does not require a database, a dashboard, or a collector service. It gives you a repeatable CPU snapshot that can be reviewed during weekly maintenance or attached to an incident note.
Schedule it with cron without creating noise
For cron CPU monitoring on Linux, choose a cadence that matches your risk. A busy e-commerce system may need samples every five minutes. A small internal app may only need hourly samples plus a weekly review. Start with hourly checks unless you already know you need more detail:
sudo tee /etc/cron.d/simple-cpu-monitor >/dev/null <<'EOF'
SHELL=/bin/bash
PATH=/usr/local/sbin:/usr/local/bin:/usr/sbin:/usr/bin:/sbin:/bin
15 * * * * root /usr/local/sbin/simple-cpu-monitor
EOF
Make sure the log will not grow forever. Add log rotation so the monitoring helper stays lightweight:
sudo tee /etc/logrotate.d/simple-cpu-monitor >/dev/null <<'EOF'
/var/log/simple-cpu-monitor.log {
  weekly
  rotate 8
  compress
  missingok
  notifempty
}
EOF
If cron mail is enabled, avoid scripts that print normal output to standard output every hour. Routine success should be quiet; failures should be visible. That keeps the check useful instead of becoming background noise.
Know what normal looks like
A snapshot is only valuable when you compare it with a baseline. During the first week, review the log and identify normal business-hour load, normal overnight load, and any scheduled-job spikes. Then compare future weeks against those baselines.
Watch for these patterns:
- Rising 15-minute load: sustained pressure is more important than a one-minute burst.
- High iowait: the CPU may be waiting on disk rather than doing useful work.
- High steal time: a virtual machine may be competing with other tenants on the host.
- Recurring top process: the same job or query may need tuning, scheduling, or isolation.
This is where lightweight monitoring becomes practical infrastructure management. You are not trying to collect every metric. You are trying to spot the few changes that explain real user impact.
Turn CPU findings into next actions
When the trend changes, use the CPU snapshot to decide where to look next. If user CPU climbs and one application process dominates, review recent deployments, traffic changes, and expensive code paths. If iowait rises, check disk latency, backup timing, swap activity, and database queries. If steal time rises, review the virtual machine size, hosting plan, and noisy-neighbor risk.
A simple weekly note can be enough:
- Average business-hour load compared with last week.
- Highest recurring CPU process.
- Any iowait or steal-time warning signs.
- One recommended action, even if the action is “no change needed.”
That final item matters. Monitoring that never turns into a decision becomes another log nobody reads. Monitoring that ends with a clear recommendation helps small teams act before a small trend becomes an outage.
When simple monitoring is enough, and when it is not
Simple CPU monitoring without tools is a good fit for early warning, low-traffic servers, internal applications, and teams that need a dependable weekly health check. It is not enough for high-traffic platforms, multi-node systems, strict service-level objectives, or environments where you need alert routing, long-term metric retention, and detailed dashboards.
If the simple approach keeps flagging problems, that is not a failure. It is evidence that you may need deeper application profiling, database tuning, capacity planning, or a managed monitoring service. The lightweight check earns its keep by telling you when to make that next investment.
Bottom line
You do not need a complex platform to begin monitoring CPU health on Linux. Start with load average, CPU states, top processes, and trend direction. Capture those signals on a schedule, review them weekly, and connect each finding to a practical decision.
Want weekly infrastructure health checks without dashboard fatigue?
DMCloud Architect sends Linux and MySQL infrastructure health reports directly to your inbox, so you can spot risks early without adding another monitoring dashboard to watch.
Get the free starter plan for weekly infrastructure health reports.