Many MySQL environments start small and run without dedicated monitoring. Everything seems fine until users report slow queries, applications begin timing out, or backups fail without anyone noticing. By the time the issue is discovered, troubleshooting often becomes more difficult than it should be.
A simple monitoring approach helps administrators identify problems early without deploying a complex observability platform. The goal is not to collect every possible metric. Instead, focus on a small set of indicators that provide a clear picture of database health and performance.
Why Simple MySQL Monitoring Works
Organizations often assume effective monitoring requires dozens of dashboards and thousands of metrics. In reality, a lightweight approach is usually enough for small and medium-sized deployments.
Simple monitoring allows teams to:
- Detect performance issues before users complain
- Track database growth trends
- Identify resource bottlenecks
- Verify backups and maintenance tasks
- Reduce troubleshooting time during incidents
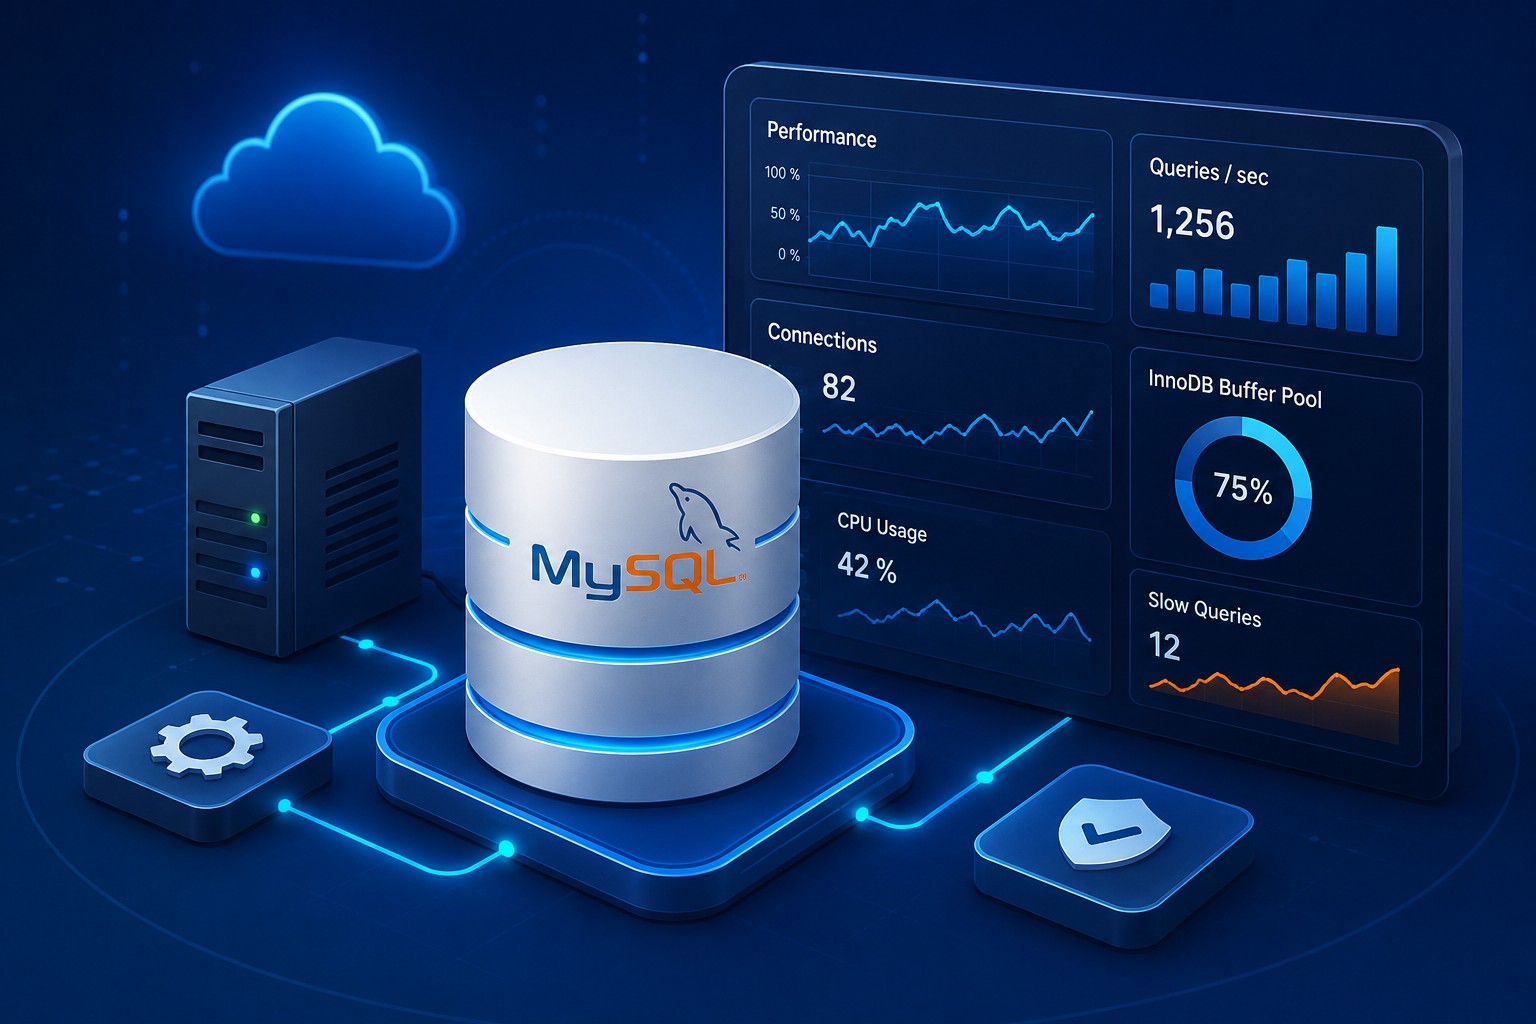
Key Metrics to Monitor
Server Availability
The first requirement is knowing whether the MySQL server is reachable. A failed database service can immediately impact applications, websites, and internal systems.
Connections
Monitoring active connections helps identify overloaded systems, connection leaks, and unexpected spikes in activity.
Query Performance
Slow queries are one of the most common causes of MySQL performance problems. Tracking slow query counts and execution trends provides early warning signs.
CPU and Memory Usage
High CPU utilization or memory pressure can indicate inefficient queries, insufficient resources, or workload growth.
Storage Capacity
Database outages frequently occur because storage fills unexpectedly. Monitoring available disk space should always be part of mysql server monitoring.
Building a Lightweight Monitoring Strategy
Start with basic health checks and expand only when necessary. A practical approach includes:
- Monitor database availability every few minutes.
- Track CPU, memory, and disk usage.
- Collect slow query statistics.
- Review connection counts and trends.
- Verify successful backups.
- Generate periodic health reports.
This approach keeps mysql monitoring lightweight while still providing valuable operational visibility.
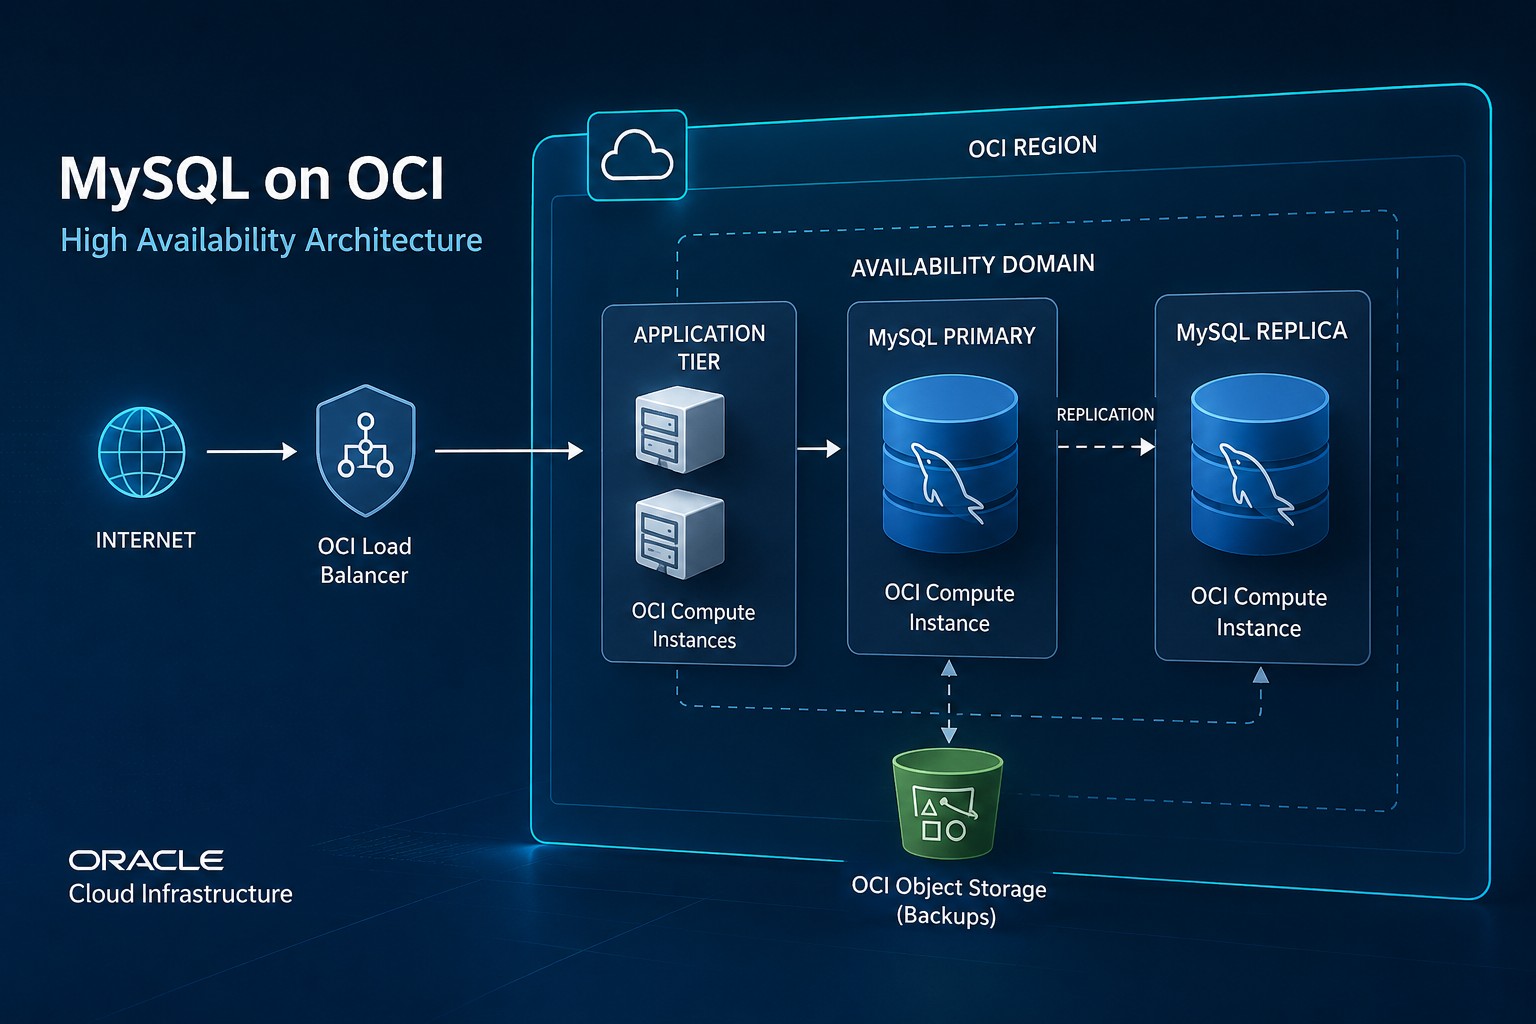
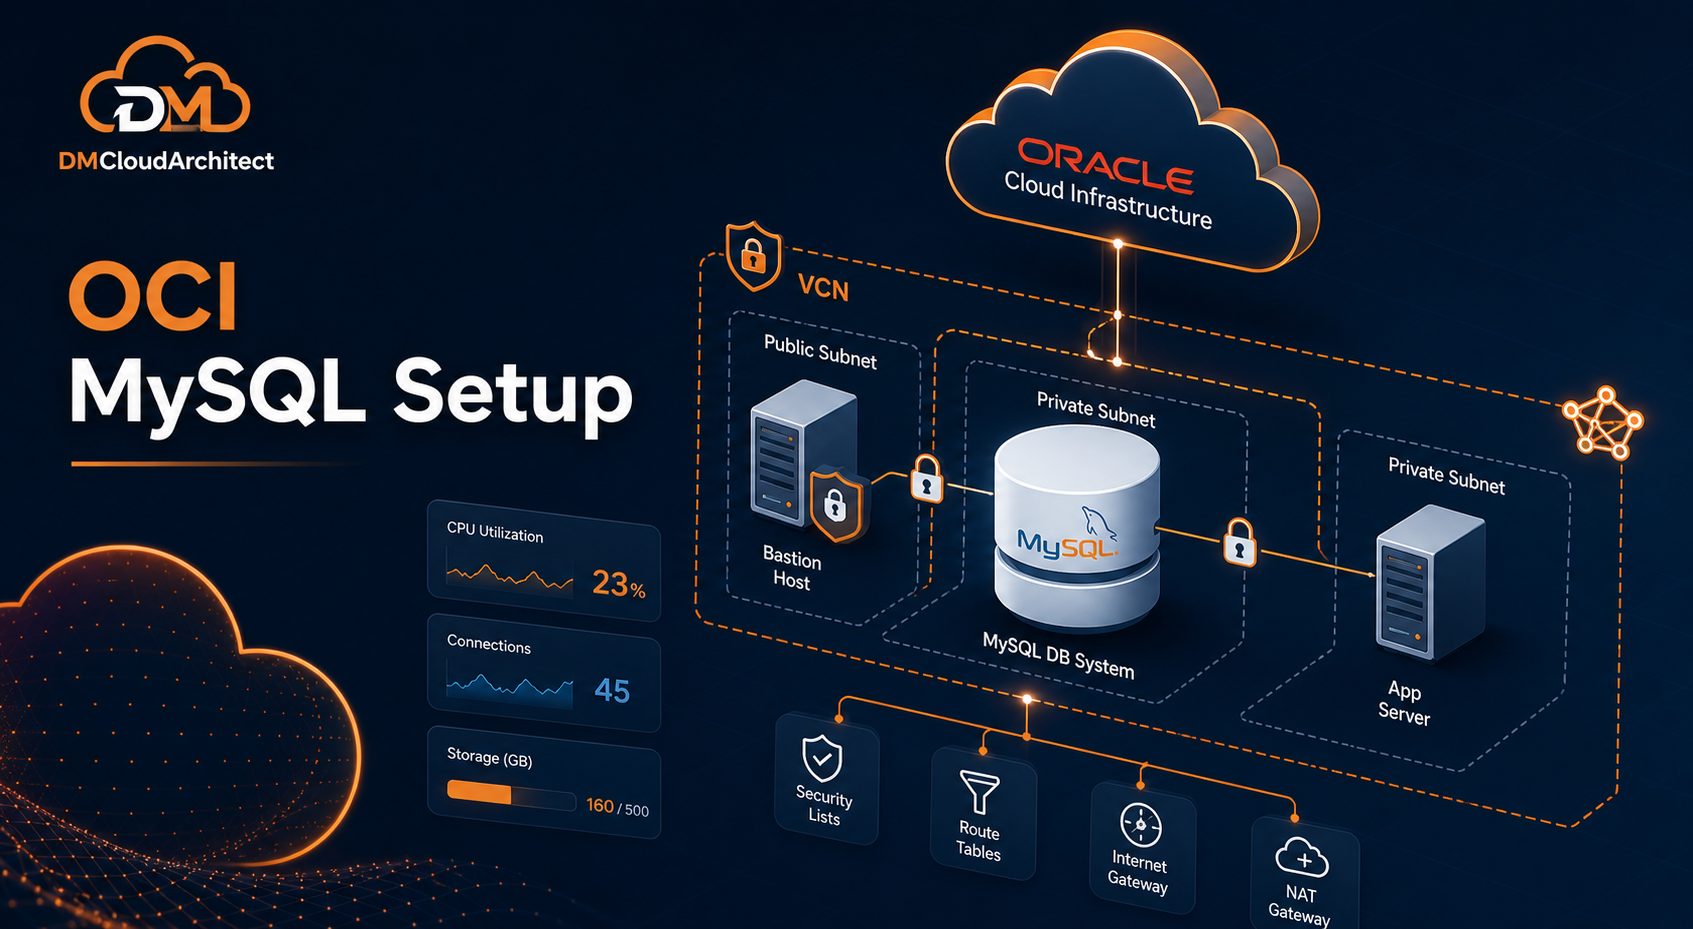
Real-World Example
Consider a business application running on Oracle Cloud Infrastructure with a single MySQL instance. Users begin reporting intermittent slowness during peak hours. Basic monitoring reveals that connection counts increase sharply every afternoon and slow queries rise at the same time.
Without monitoring, administrators might spend hours investigating the application stack. With a simple monitoring setup, the issue can be traced directly to a handful of inefficient queries, significantly reducing resolution time.
Common Mistakes to Avoid
- Monitoring too many metrics from the start
- Ignoring storage growth trends
- Failing to review slow query logs
- Not validating backup success
- Collecting data without reviewing reports
Summary
Simple MySQL monitoring focuses on the metrics that matter most: availability, performance, connections, resource usage, and storage capacity. A lightweight strategy is often enough to identify issues early and maintain stable database operations.
If you want a structured way to review infrastructure and database health, explore Infrastructure Health Reporting at https://dmcloudarchitect.com/infrastructure-health-reporting.html to help maintain visibility across critical systems.