A MySQL server rarely becomes slow all at once. More often, the workload grows quietly: a report runs against twice as many rows, a background import overlaps with customer traffic, one endpoint starts issuing more queries, or a new feature changes the shape of common database access.
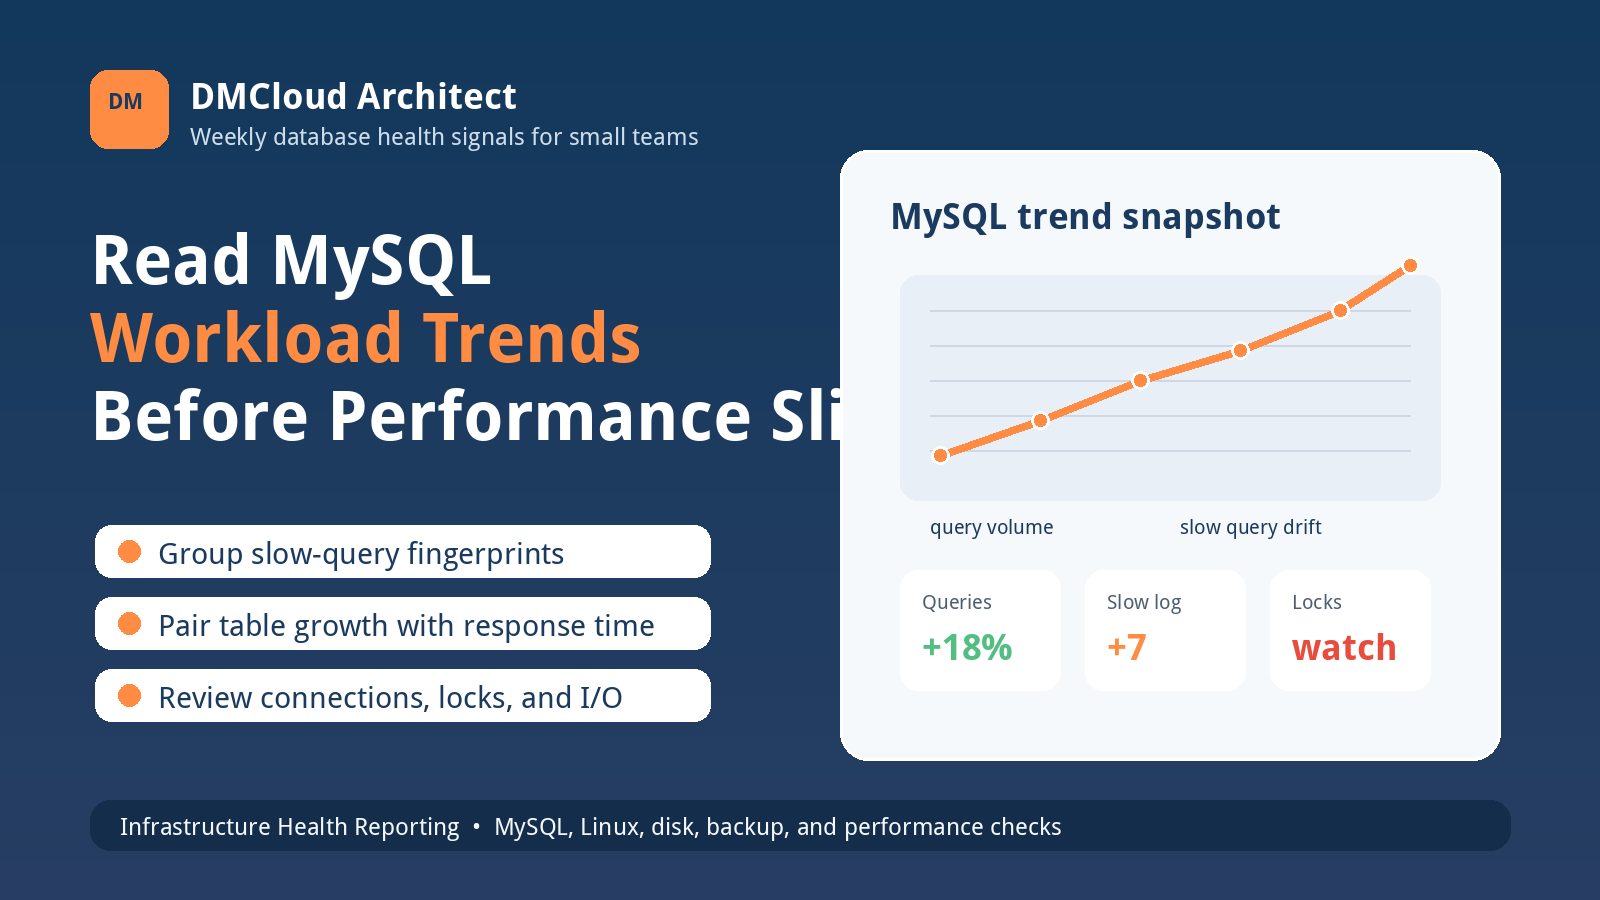
That is why mysql workload trends are so useful for developers and small business owners. They show whether the system is drifting toward trouble before the team is forced into urgent troubleshooting. A weekly trend review can turn vague complaints like "the app feels slower" into specific evidence about query volume, table growth, slow statements, connections, and server pressure.
Start with workload, not just uptime
Uptime tells you whether MySQL is reachable. Workload tells you how hard it is working and whether that work is changing. A database can be perfectly "up" while customers experience slow checkout, admin reports time out, or nightly jobs run into business hours.
A practical review starts by asking what MySQL did this week compared with last week. Did total queries rise? Did read/write balance change? Did one application job begin running more often? Did the slow query log show a new pattern? These questions make monitoring more operational than a green-or-red availability check.
Track query volume and query mix
Total query count is a simple but useful baseline. If the business had a promotion, a seasonal spike, or a new integration, a higher query count may be expected. If query volume jumps without a matching business reason, investigate application behavior, retries, bot traffic, reporting tools, or background workers.
The mix of queries matters too. A server that moves from mostly short indexed reads to more large joins, sorts, exports, or update-heavy batches will feel different even if CPU averages look acceptable. Weekly mysql performance trends should separate everyday request traffic from scheduled reports, imports, maintenance tasks, and unusual bursts.
Watch slow queries as a trend, not a hall of shame
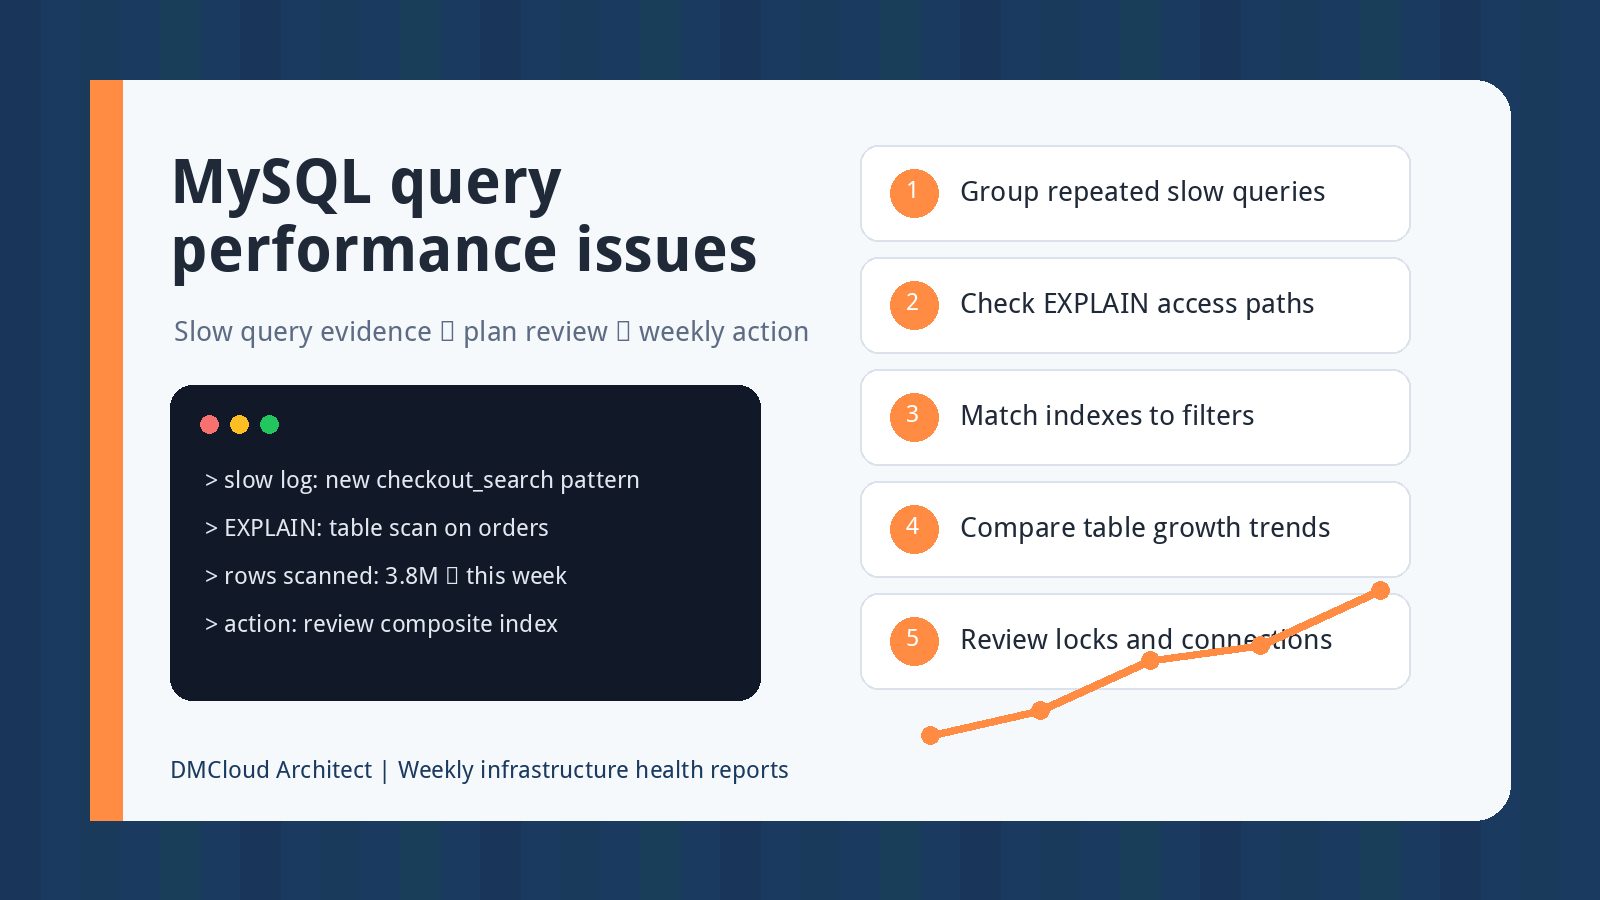
The slow query log is most helpful when it is compared over time. A single list of slow statements can lead to one-off fixes. A trend view shows whether a query pattern is new, becoming slower, happening more often, or tied to a specific day of the week.
For small teams, the goal is not to paste raw SQL into a report. Group similar query fingerprints and summarize the pattern: what feature or report is affected, how often it appeared, how the average and worst times changed, and what likely changed in the data or access path. That context turns mysql query trends into a developer-ready action item.
Pair table growth with query behavior
Many MySQL slowdowns are really growth stories. A query that was fine against 80,000 rows may become painful against 8 million rows. The SQL text may not change, but the amount of data behind it does.
Track the tables that represent business growth: orders, events, audit logs, customer activity, subscriptions, tickets, inventory, or analytics rows. Then connect table growth to the queries and reports that touch those tables. If an audit table grew 35 percent this month and the admin activity report is now in the slow log, the team has a much clearer starting point than "the database is slow."
Review connections, locks, and waits
Workload trends are not only about query text. A healthy-looking query can wait behind locks, queue behind too many active connections, or slow down because several jobs are competing for disk and memory at the same time.
Include active connections, connection errors, long-running transactions, lock waits, temporary table activity, and aborted connections in the weekly review. These signals help distinguish SQL tuning from workload scheduling. If a backup, import, or billing job overlaps with peak traffic, the right fix may be pacing or rescheduling rather than adding an index.
Compare database signals with Linux server pressure
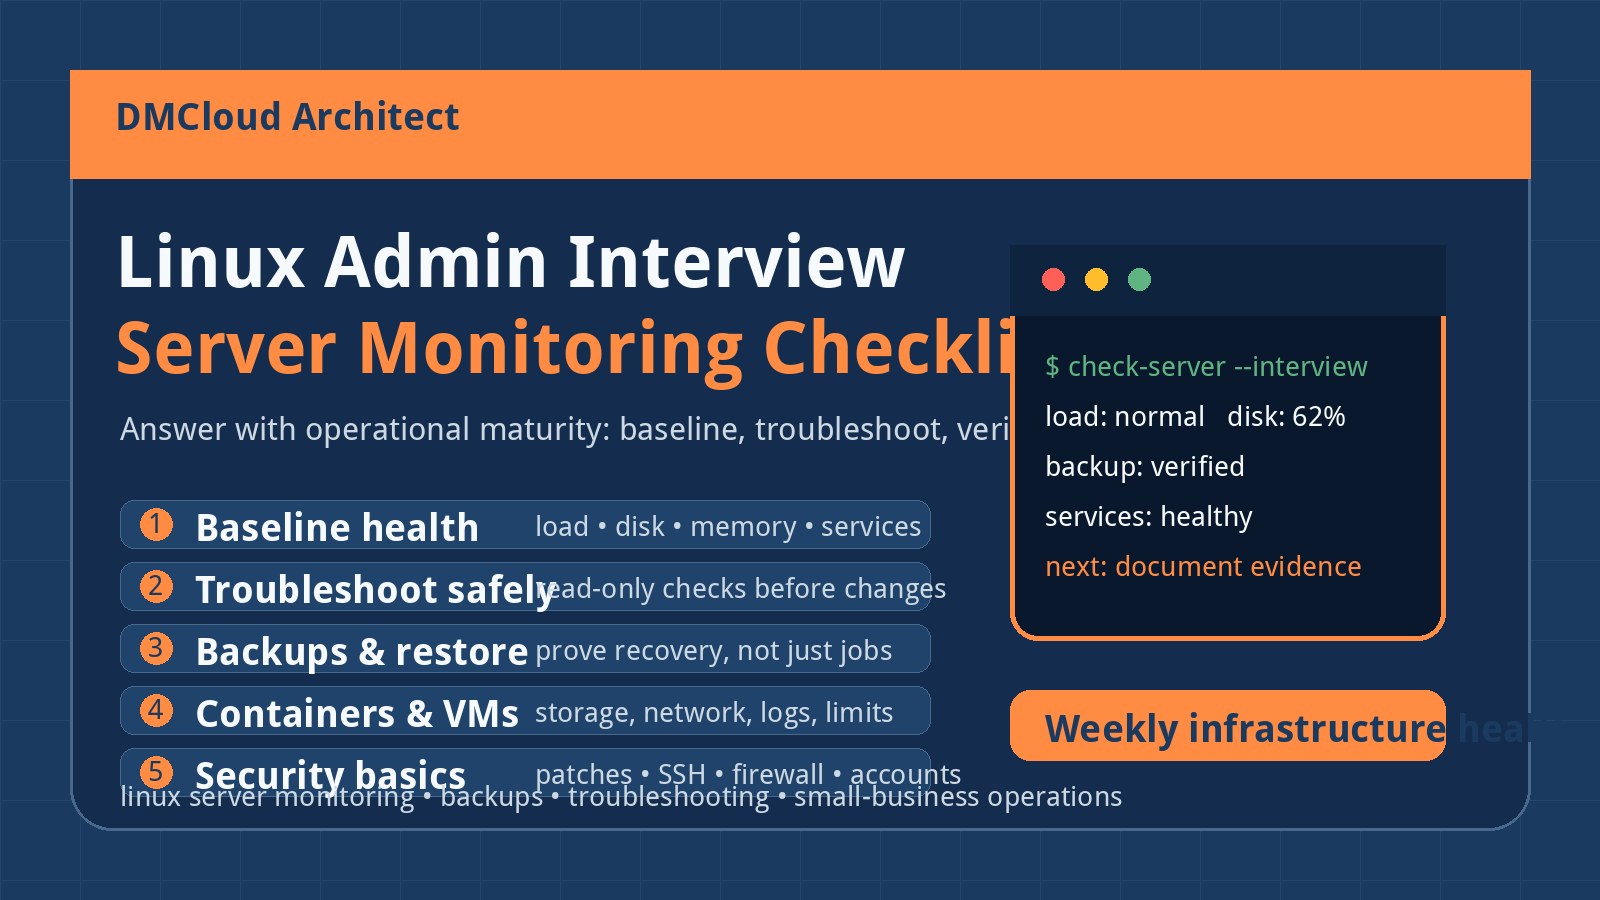
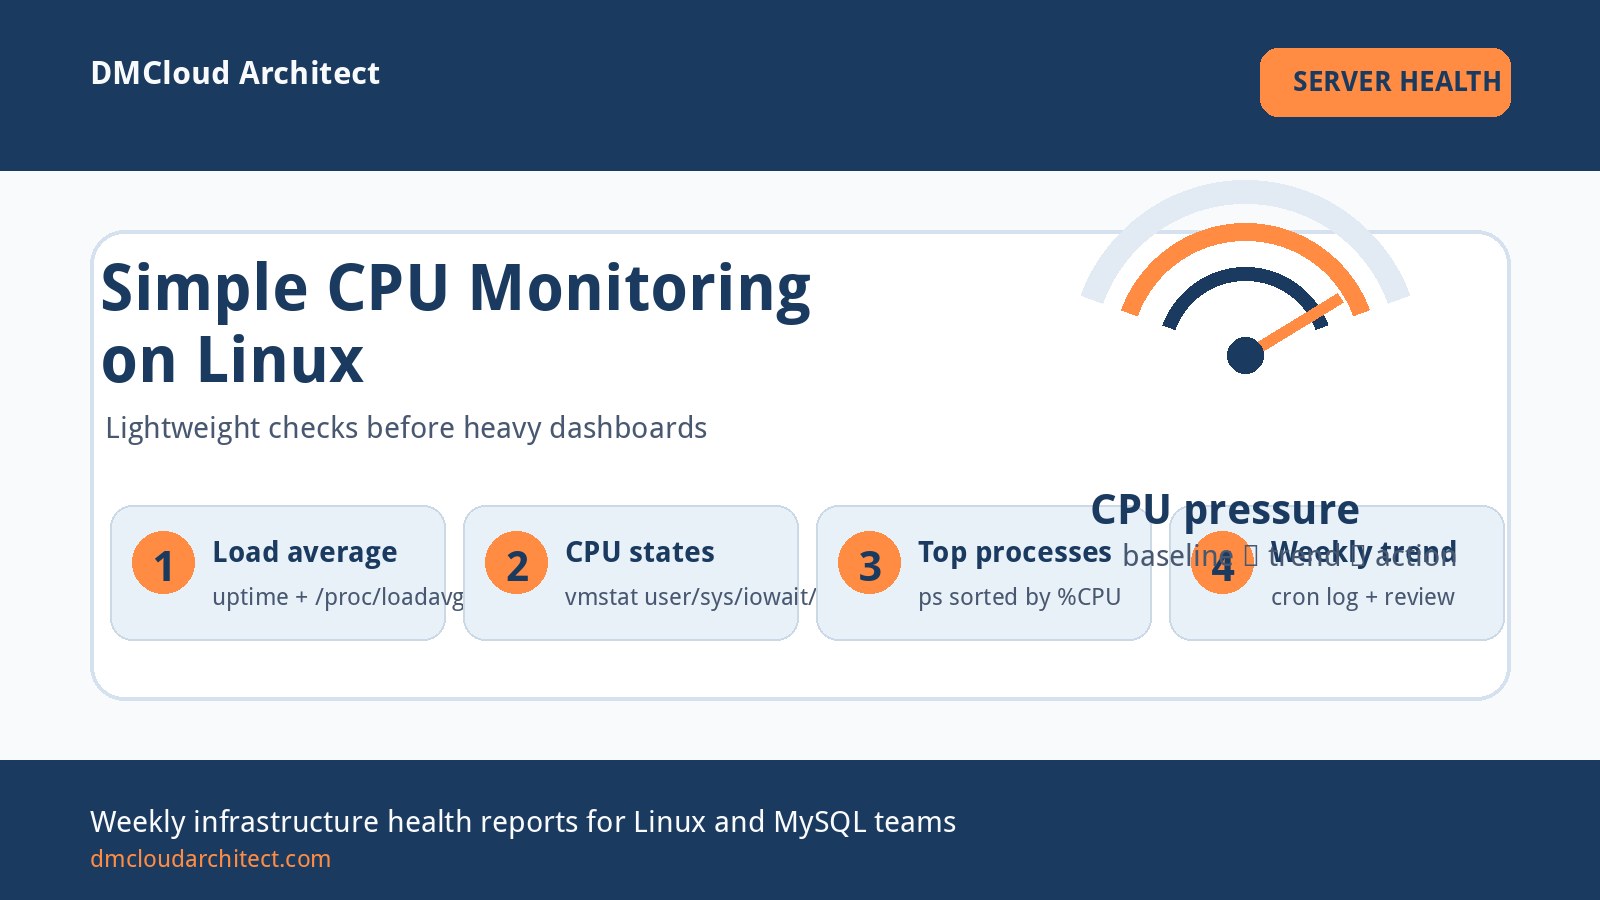
MySQL does not run in isolation. CPU load, memory pressure, swap usage, disk latency, filesystem fullness, and noisy neighboring processes can all create mysql slow performance over time. A database trend report should sit beside basic Linux health checks instead of treating MySQL as a black box.
Look for correlations. Did slow query time rise during periods of high I/O wait? Did connection pileups happen when disk usage crossed a threshold? Did memory pressure increase after a configuration change? These comparisons keep the team from chasing SQL fixes when the root cause is broader infrastructure pressure.
Separate alerts from weekly trend reports
Some MySQL conditions deserve immediate alerts: the service is down, disk is critically full, connections are exhausted, replication is broken, or production queries are blocked by a lock pileup. Trend monitoring serves a different purpose. It gives the team space to fix issues before they become emergencies.
A good weekly note might say: "Customer activity queries increased 28 percent, the events table added 1.2 million rows, and the account-date report appeared in the slow log 19 times. Review index coverage and report date ranges before the next billing cycle." That is more useful than a dashboard screenshot because it includes the risk, evidence, and next step.
Build a lightweight MySQL workload checklist
You do not need a complex program to start. Create a checklist that covers total query volume, slow query patterns, top growing tables, read/write balance, active connections, long transactions, lock waits, disk space, disk latency, CPU load, memory, and recent deployments or scheduled jobs.
Run that checklist weekly and keep the notes short. Over time, the history becomes valuable. You can see which fixes actually improved the trend, which risks keep returning, and whether normal business growth is outpacing the current database design or server size.
Make the trend report easy to act on
The best MySQL trend report is written for action, not for database specialists alone. Developers need enough detail to reproduce and fix the issue. Business owners need to understand whether the risk affects customers, reporting, operations, or growth planning.
Use plain-language summaries: what changed, why it matters, what evidence supports it, and what the next action should be. When MySQL workload trends are reviewed this way, monitoring becomes a calm maintenance rhythm instead of an emergency-only activity.
Want MySQL workload trends reviewed before they become incidents?
DMCloud Architect turns MySQL, Linux, disk, backup, and performance checks into weekly infrastructure health reports for small teams that want early warning without dashboard fatigue.
Get the free starter plan for weekly infrastructure health reports.