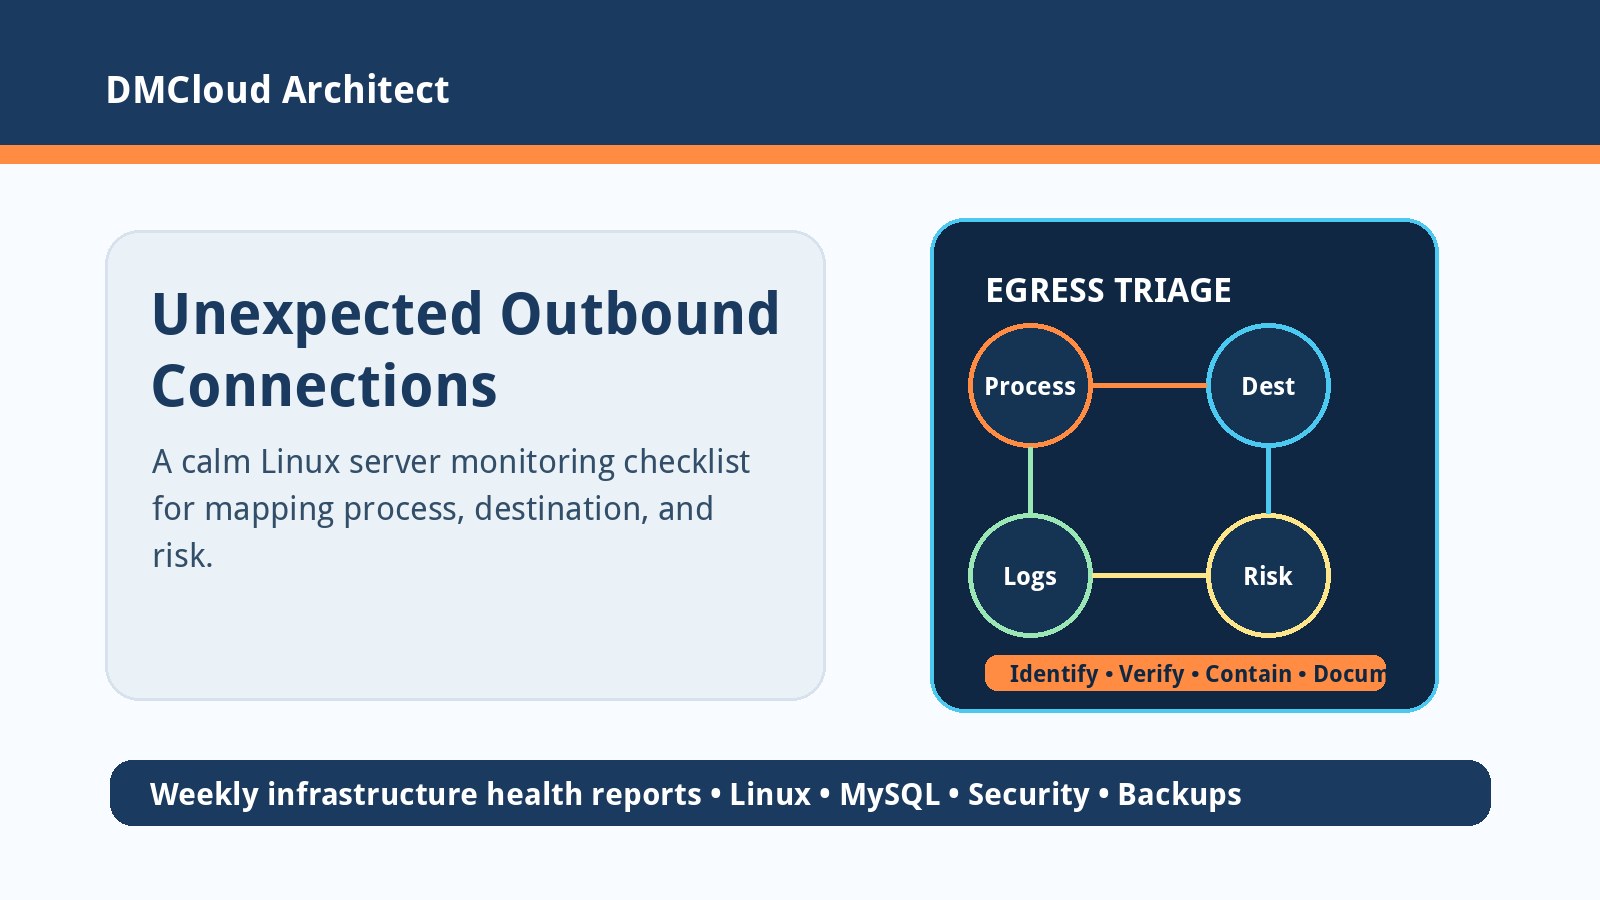
An unexpected outbound connection from a Linux server deserves attention, but it does not always mean compromise. Package updates, telemetry, DNS lookups, monitoring agents, backup jobs, container pulls, and third-party APIs can all create network traffic that looks unfamiliar at first glance. The key is to investigate calmly, preserve evidence, and use your linux server monitoring routine to separate normal operations from real risk.
This checklist is written for developers and small business owners who manage practical production systems without a dedicated security operations team. It focuses on repeatable triage: identify the process, confirm the destination, check whether the behavior matches the server's role, and decide what to block, document, or escalate.
1. Capture the facts before changing anything
Start by recording the time, host, user, process name, PID, local port, remote IP or hostname, destination port, connection state, and how you noticed the connection. If the signal came from a firewall, cloud flow log, endpoint tool, or netstat-style command, save the original output before restarting services or killing processes.
That snapshot matters because network behavior can be short-lived. A cron job may connect for a few seconds and disappear. A deployment hook may run once after a release. Capturing the original evidence gives you something to compare against logs, package history, DNS, and application configuration.
2. Map the connection to a process and service
The first practical question is simple: which program opened the connection? Use process and socket views such as ss -tunap, lsof -i, service status, container metadata, and systemd unit names to map the network socket back to the workload that owns it. On container hosts, also identify the container image, namespace, and orchestrator service.
Once you know the owner, compare it with the server's purpose. A web application calling a payment API may be expected. A database server opening an outbound SSH session may not be. A monitoring agent calling its vendor endpoint may be normal, while the same destination from an unknown binary needs deeper review.
3. Verify the destination without trusting labels
Do not stop at a reverse DNS name. Check the IP address, ASN or cloud provider, destination port, TLS certificate, and whether the hostname appears in application configuration, package documentation, vendor allowlists, or recent deployment notes. DNS names can be missing, stale, generic, or misleading.
For small teams, a simple destination inventory helps. Keep a short list of approved outbound services: update mirrors, backup targets, email providers, payment processors, object storage, monitoring vendors, and partner APIs. Unknown destinations are much easier to triage when expected traffic is already documented.
4. Correlate with logs, deployments, and scheduled jobs
Network activity rarely exists in isolation. Check application logs, system logs, authentication logs, package manager history, cron/systemd timers, CI/CD release times, backup schedules, and configuration changes around the connection timestamp. If the connection started immediately after a deployment, review dependencies and new integration code before assuming an intrusion.
This is where linux server monitoring should provide context beyond a single alert. CPU spikes, service restarts, failed logins, unusual disk writes, new processes, package updates, and outbound connections all become more useful when they are reviewed together in a weekly or incident-specific health report.
5. Look for risk indicators around the process
After mapping the connection, inspect the process environment carefully. Confirm the executable path, file owner, package origin, command-line arguments, parent process, open files, loaded service unit, and recent modification time. For suspicious cases, calculate hashes and compare the binary with a known-good package or image.
- High concern: unknown binary in
/tmp, hidden directories, unexpected shells, encoded command strings, recently modified executables, or traffic to destinations unrelated to the service. - Medium concern: known software making a new connection after an update, a new third-party dependency, or a destination that is plausible but undocumented.
- Lower concern: documented vendor endpoints, package mirrors, backup targets, or monitoring agents that match approved configuration.
6. Decide whether to block, observe, or escalate
If the connection is clearly unauthorized or tied to a suspicious process, isolate the host or workload according to your incident plan, preserve logs, rotate exposed credentials, and involve security help if needed. If the destination is plausible but undocumented, temporarily monitor it more closely while you confirm with the application owner or vendor documentation.
Avoid making permanent firewall changes without understanding the business impact. Blocking a backup, payment, email, DNS, update, or monitoring endpoint can create a new outage while you are trying to investigate the old signal. The safest response is evidence first, containment when warranted, and documentation once the root cause is clear.
7. Turn the finding into better outbound visibility
Every investigation should improve the next one. Add confirmed destinations to an allowlist, remove obsolete firewall rules, document vendor endpoints, tune alert thresholds, and record which commands helped you identify the process. If the server handles sensitive data, consider egress filtering so only required destinations are allowed by default.
For developers, this also means making application network behavior explicit. Put third-party APIs, callback URLs, update channels, and telemetry settings in deploy notes. When a dependency starts calling a new endpoint, the operations team should not have to discover it from a mystery firewall alert.
Practical outbound connection investigation checklist
- Record the timestamp, host, remote IP/port, protocol, connection state, and original alert source.
- Map the socket to a process, systemd unit, container, user, and executable path.
- Verify the destination using IP ownership, DNS, certificates, vendor docs, and application configuration.
- Correlate with deployments, package updates, cron jobs, backups, authentication logs, and service restarts.
- Inspect the process owner, parent process, command line, binary path, package origin, and recent file changes.
- Classify the finding as expected, undocumented, suspicious, or confirmed incident.
- Choose a response: document, observe, block, isolate, rotate secrets, or escalate.
- Update your approved outbound inventory and monitoring notes after the investigation.
What to monitor weekly
Small teams do not need a massive security platform to start improving outbound visibility. A useful weekly report can highlight new listening ports, unusual outbound destinations, recent package changes, failed SSH attempts, service restarts, disk growth, backup freshness, and database health. Those basics make an unexpected connection easier to interpret because they show what else changed on the server.
The goal is not to panic over every new connection. The goal is to notice meaningful changes early, investigate them with enough context, and keep a written record of what is normal for each server.
Want weekly Linux server health checks without dashboard fatigue?
DMCloud Architect turns infrastructure signals into plain-language reports so small teams can spot process, capacity, database, and security risks early.
Get the free starter plan for weekly infrastructure health reports.