Disk problems often look sudden from the outside. A deploy fails, MySQL cannot write temporary files, uploads stop, or log rotation breaks during a busy morning. In many cases, the server gave simple warnings first. Disk monitoring without tools means using built-in Linux commands, a small checklist, and a weekly review habit to spot those warnings before they become downtime.
This approach is useful for developers and small business owners who do not want a full monitoring platform for one or two servers. You can get a meaningful view of disk health with shell commands, scheduled reports, and a few trend notes. The goal is not to replace every alerting product. The goal is to know whether storage is healthy, drifting, or already close to action.
Start with the disk question that matters
The most useful storage question is not only “how full is the disk today?” It is “how fast is this filesystem changing, and what will happen if that pace continues?” A one-time df -h check can show that / is 72% used, but it cannot tell you whether that number has been stable for months or jumped by 20% since last week.
For a lightweight weekly routine, record total size, used space, available space, and percent used for every important filesystem. Include root, application data, database storage, uploads, backups, and separate log or cache volumes. Small partitions such as /var or a backup mount can cause the incident even when the largest disk still looks comfortable.
Use Linux commands you already have
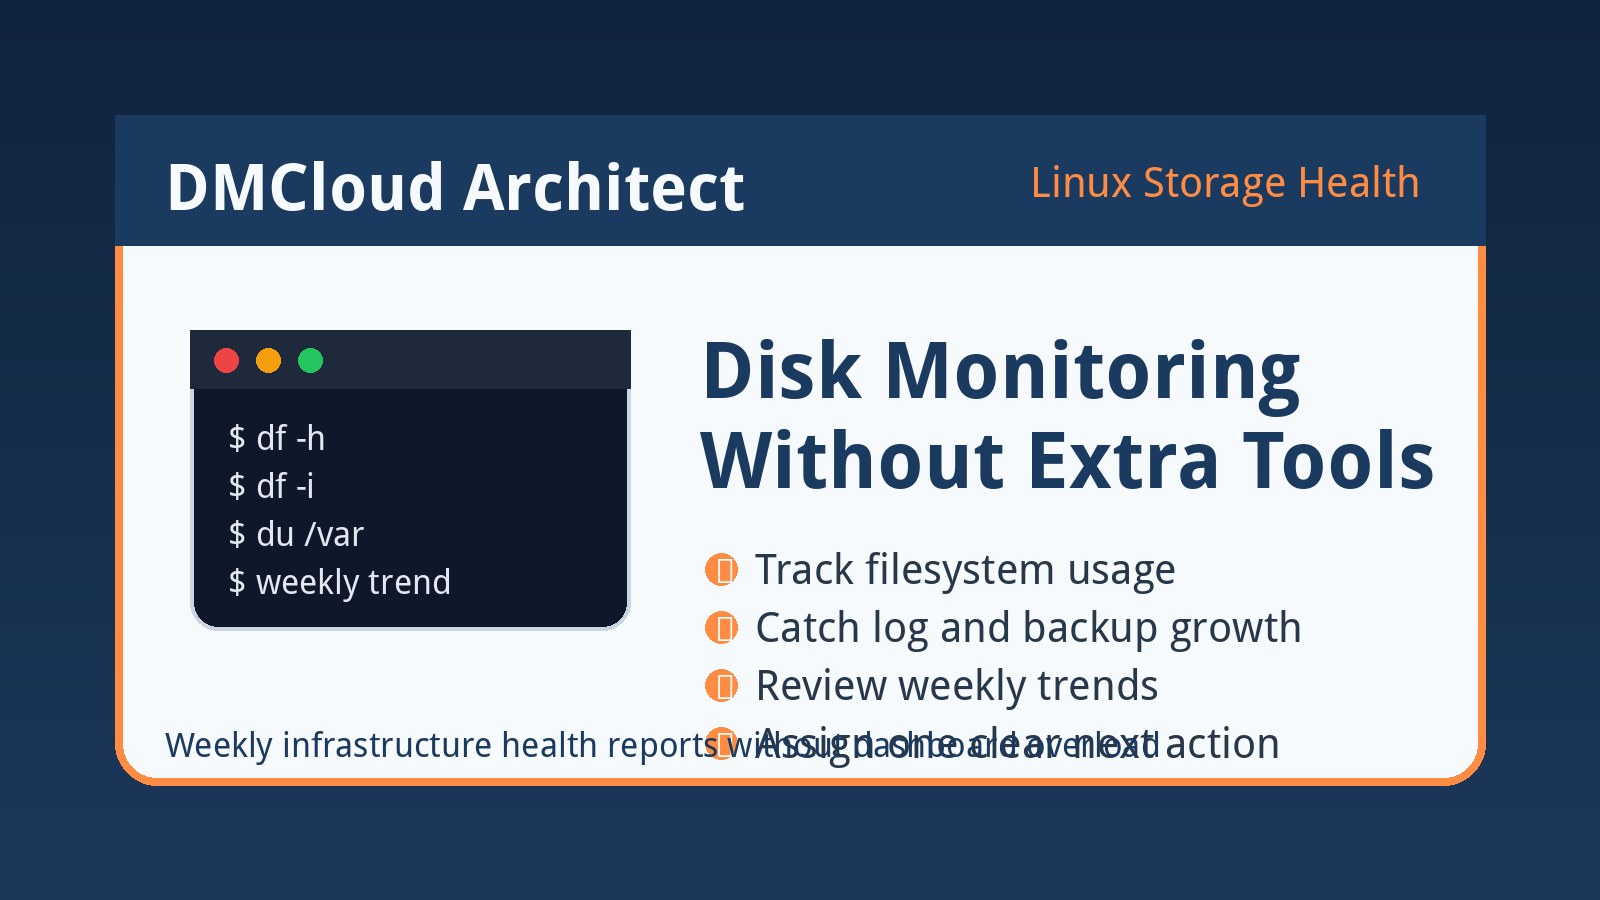
You can begin with a short command set that exists on almost every Linux server. df -h gives the human-readable filesystem view. df -i catches inode exhaustion, which can break applications even when free gigabytes remain. du -xh --max-depth=1 /var helps identify which top-level directory is growing without crossing filesystem boundaries.
For deeper checks, review application upload directories, database directories, web logs, package caches, container storage, and backup locations. A simple weekly note that says “/var grew by 11 GB; largest change is /var/log/app” is far more useful than a vague “disk is high” alert. It points directly toward investigation.
Track growth rate, not just thresholds
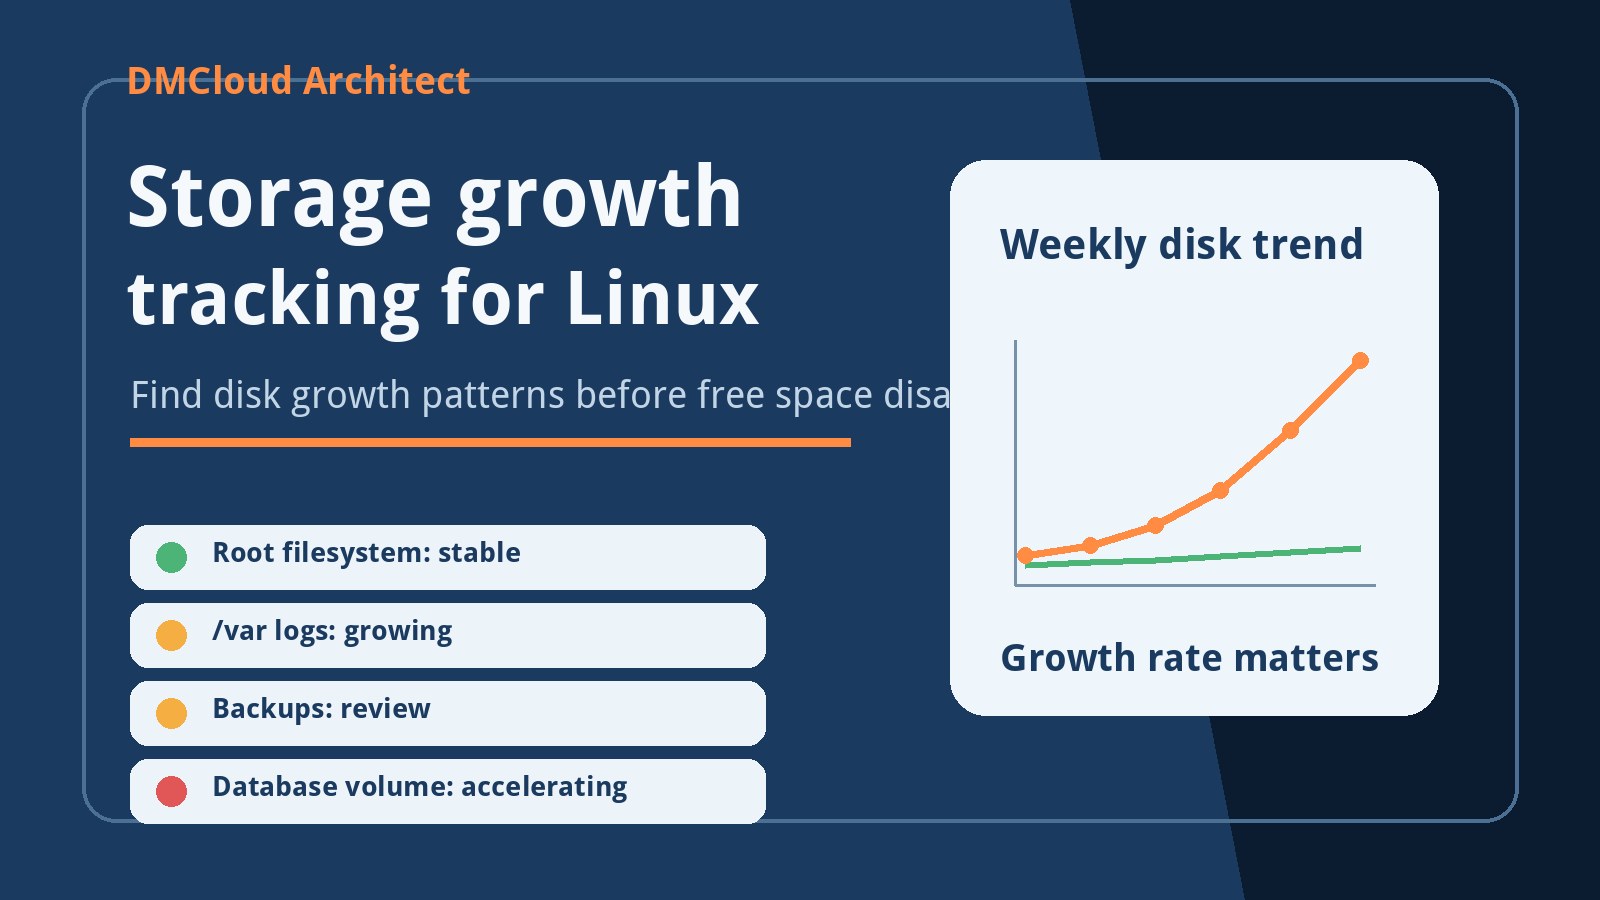
Traditional warning thresholds such as 80%, 90%, and 95% are helpful, but they are incomplete. A server at 82% usage may be safe if it grows slowly. A server at 62% may be risky if a bad log loop is adding several gigabytes per day. Growth rate shows how much response time you really have.
A practical disk usage script for Linux can save the output of df with a timestamp, then compare the result to last week’s report. Even a spreadsheet or text file is enough at first. Record the weekly change for each important mount and flag anything that grows faster than normal. The trend is what turns raw numbers into planning.
Watch logs before they fill /var
Logs are one of the easiest ways for disk usage to accelerate unexpectedly. A failed API call, authentication loop, noisy debug setting, bot traffic spike, or application exception can write thousands of lines per minute. If /var is rising faster than usual, logs should be one of the first places to inspect.
Check the largest log files, recent modified times, compressed archives, and whether log rotation is actually running. If a log is growing quickly, avoid treating deletion as the only fix. The better fix may be correcting the underlying error, changing retention, reducing verbosity, or moving noisy diagnostics out of production.
Include MySQL and database storage
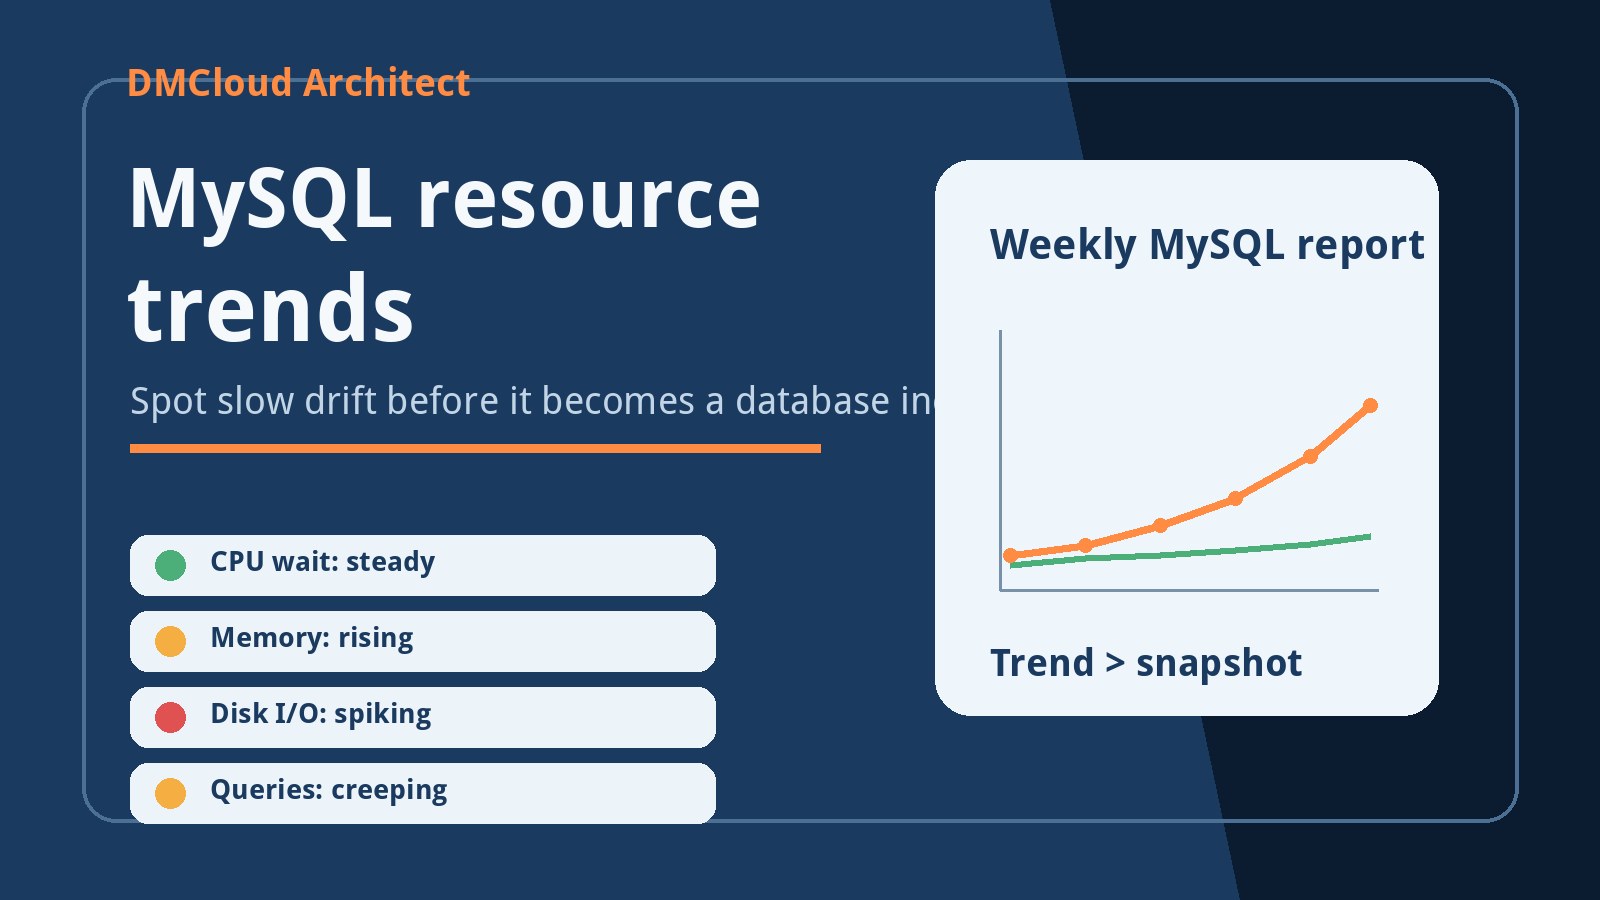
Database files deserve their own line in a disk monitoring checklist. MySQL data files, indexes, temporary tables, binary logs, slow query logs, and backups can all grow for different reasons. If database storage is expanding every week, the right next action may involve retention rules, query review, archiving, binary log settings, or backup placement.
Small teams should pay special attention to binary logs and local backups. Both are useful, but both can fill a server when retention is unclear. Before deleting anything, confirm whether replication, point-in-time recovery, or compliance retention depends on those files. Disk monitoring should make cleanup safer, not reckless.
Create a small cron disk monitoring report
A minimal cron disk monitoring Linux routine can be as simple as writing a daily or weekly snapshot to a report file. Capture filesystem usage, inode usage, largest directories under key paths, and a few service-specific checks. The report does not need to be fancy. It needs to be consistent enough that changes are obvious.
- Run
df -handdf -ifor filesystem and inode status. - Check top-level growth under
/var, application data, uploads, backups, and database paths. - List unusually large logs and recently modified large files.
- Record backup count, age, size, and whether old backups are being removed.
- Compare current usage with the previous week and mark fast growth.
- Write one next action for every warning.
This kind of bash script disk monitoring is intentionally boring. That is a strength. Boring reports are easy to review, easy to troubleshoot, and easy to keep running when the team is busy.
Turn the checklist into decisions
The final step is to translate disk signals into decisions. Use simple labels such as healthy, watch, action needed, and critical. Add the reason and the next step. “Backup volume grew 38 GB this week; review retention before Friday” is better than “disk usage 84%.” It tells a person what to do next.
Disk monitoring without tools works best when it becomes part of a larger weekly infrastructure health habit. You review storage, CPU, memory, MySQL, backups, and obvious security signals together. That gives small teams enough context to fix slow-moving risk without staring at dashboards all day.
Keep storage risk visible without dashboard overload
You do not need a complex platform to start catching disk problems earlier. Built-in Linux commands, a small cron report, and a weekly review can reveal storage growth, log spikes, inode pressure, database expansion, and backup drift before they affect customers. The important part is consistency: check the same signals, compare them over time, and assign a clear next action.
DMCloud Architect provides weekly Linux and MySQL infrastructure health reports for teams that want early warnings without another dashboard to manage. If you want a practical way to track disk risk, server health, backups, and next actions, start with the Infrastructure Health Reporting page.