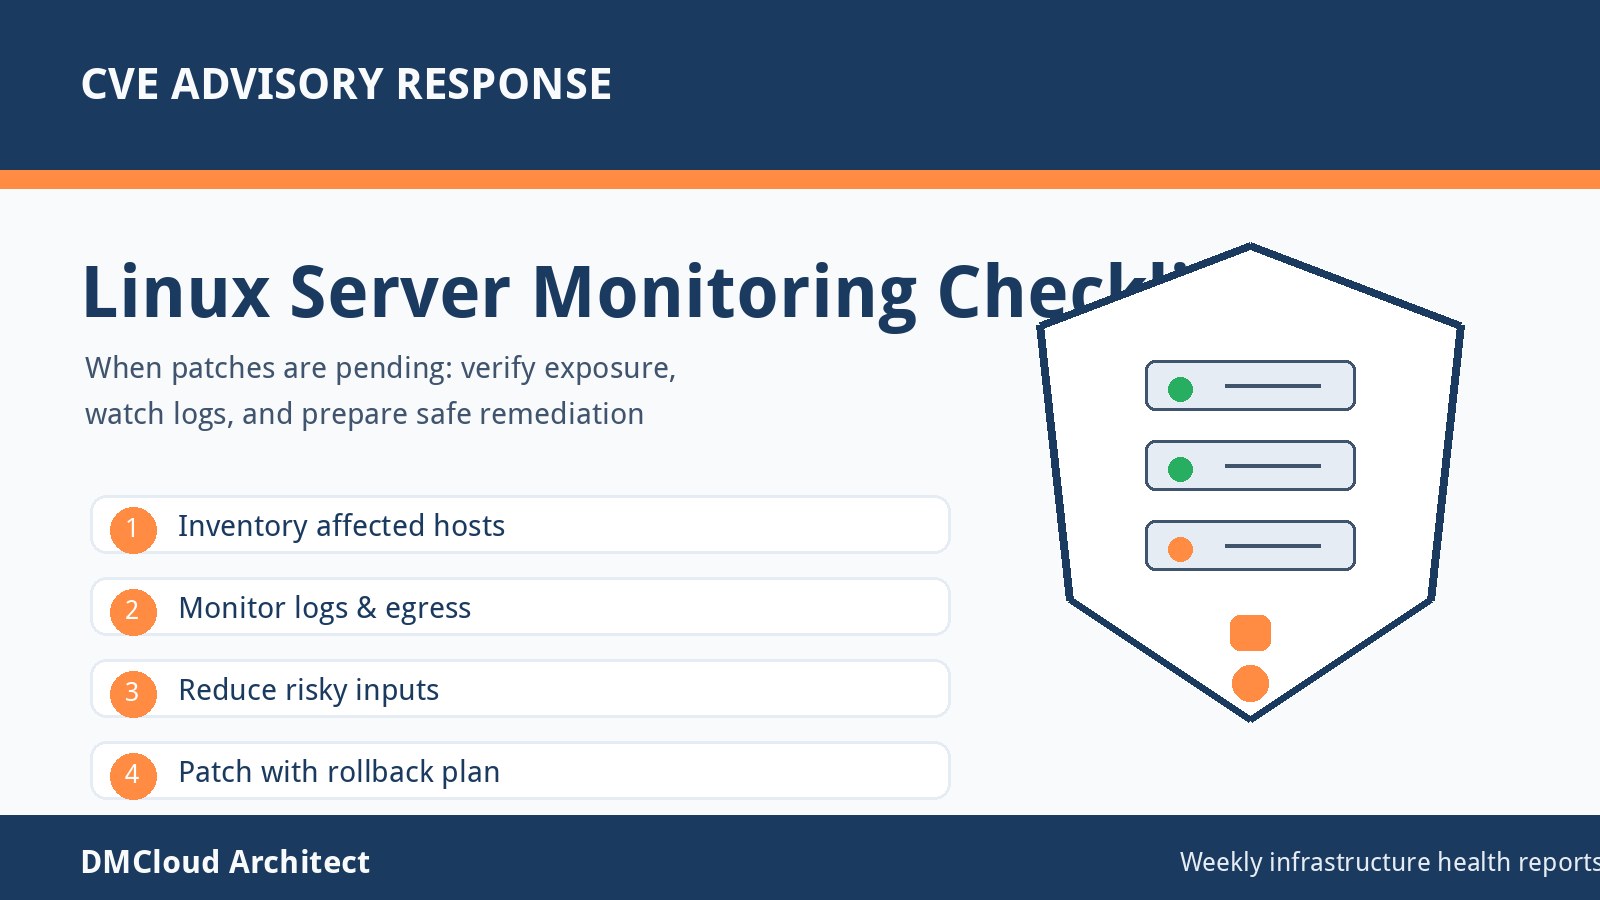
A serious Linux security advisory can create an awkward gap for small teams: the issue is public, the impact sounds scary, and the fixed packages may not be available for every affected platform yet. That gap is where rushed work often causes avoidable outages. A better response is to confirm exposure, reduce obvious risk, watch the right signals, and prepare a controlled patch window.
This checklist is written for developers, small business owners, and hands-on operators who manage Linux servers without a full security operations center. It focuses on practical linux server monitoring steps you can take when an advisory mentions risks such as server-side request forgery, local file read, XML parsing, vulnerable packages, or affected platform components. The goal is not panic; the goal is visibility and readiness.
Start with the official advisory, not social media fragments
When a CVE starts circulating, first separate the facts from the commentary. Read the vendor advisory and capture the exact affected products, versions, components, severity, workaround language, and fixed package status. If the vendor says no fixed release is available yet, your job is to monitor and prepare, not invent a risky emergency patch.
- Affected scope: record the distributions, versions, packages, container images, managed services, and add-ons named by the vendor.
- Attack surface: identify whether the vulnerable component is exposed to the internet, internal users, uploaded files, API inputs, background jobs, or only trusted administrators.
- Exploit conditions: note whether the issue requires authentication, user-supplied files, XML parsing, specific plugins, or a service role.
- Fix status: track whether patches, mitigations, or configuration workarounds exist for each affected environment.
- Business owner: assign one person to watch updates and one person to approve maintenance timing.
Do not let the headline drive the change plan. A critical-looking advisory on a component you do not run may require documentation only, while a lower-profile advisory on a public upload path may deserve immediate containment.
Build a quick inventory of potentially affected servers
The fastest way to lose time during a security event is to ask, “Where do we run that?” after the advisory is already urgent. A simple inventory pass turns the problem from abstract fear into a list of servers and services to verify.
- Operating systems: list Red Hat, Ubuntu, Oracle Linux, Debian, and other variants separately because patch timing and package names differ.
- Package presence: check whether the named package, library, runtime, or application component is installed.
- Service usage: confirm whether the vulnerable feature is actively used, merely installed, or disabled.
- External exposure: map public endpoints, reverse proxies, upload handlers, admin interfaces, and APIs that may pass untrusted input to the component.
- Dependency owners: identify vendors, application teams, or hosting providers who may need to act before you can patch.
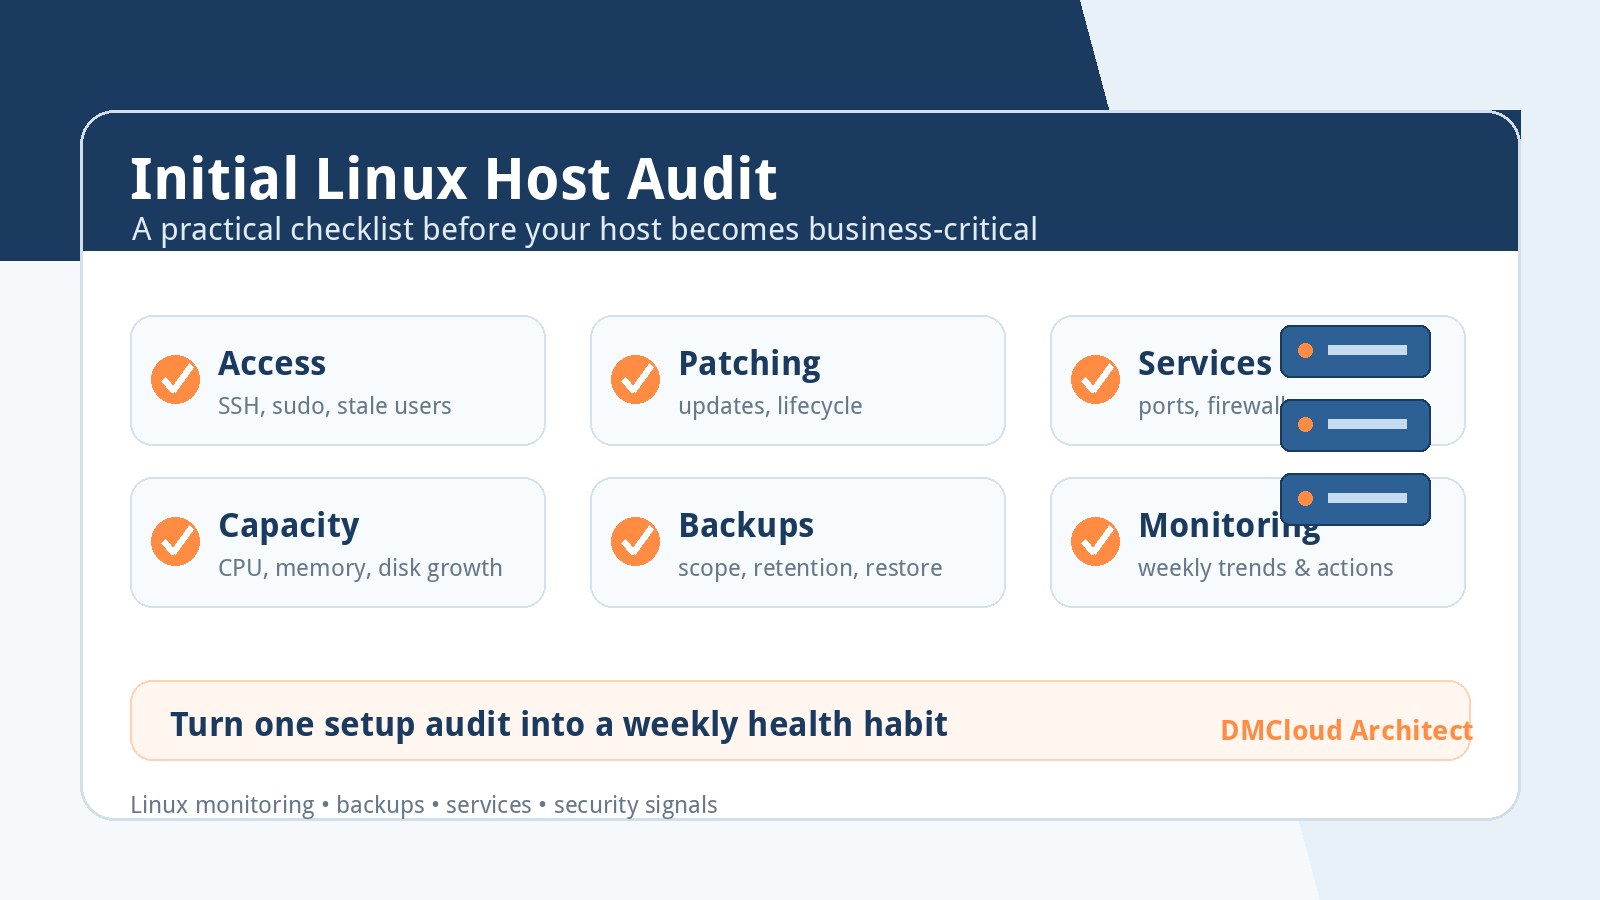
This is where regular infrastructure records pay off. If your weekly health report already lists operating system versions, key packages, public services, and open ports, advisory triage becomes much faster.
Watch for SSRF and local file read indicators
Server-side request forgery and local file read issues are tricky because a successful exploit may look like ordinary application traffic at first. Monitoring cannot prove safety, but it can reveal unusual behavior while you wait for a vendor fix or schedule maintenance.
- Outbound requests: look for unexpected calls from application servers to metadata services, localhost, private IP ranges, internal admin panels, or unusual external hosts.
- Web and API logs: review requests containing XML, schema references, file paths, encoded URLs, localhost references, or suspicious protocol handlers.
- Application errors: watch parsing failures, XML schema errors, access denied messages, unusual stack traces, and repeated 4xx or 5xx responses around upload or import features.
- File access clues: monitor attempts to read sensitive paths such as configuration files, environment files, SSH material, passwd-like files, or application secrets.
- Network controls: confirm egress rules prevent application processes from reaching destinations they should never need.
For small teams, a daily or weekly review of these signals is more realistic than building a full incident detection platform overnight. The important part is to know what changed compared with normal behavior.
Reduce exposure before the patch window
If no fixed package is available yet, you may still be able to lower risk. Focus on reversible controls that reduce untrusted input, limit outbound reach, or disable unused features without breaking the business.
- Disable unused parsers or integrations: turn off XML import, schema validation, file upload, or connector features that are not required.
- Tighten upload paths: restrict file types, size limits, authentication requirements, and who can submit data to risky processing paths.
- Limit egress: block application servers from reaching metadata endpoints, loopback-only admin tools, and internal networks they do not need.
- Protect secrets: review filesystem permissions for config files, environment files, private keys, and application credentials.
- Add temporary logging: increase logging around vulnerable endpoints only as much as your disk and privacy requirements allow.
A good temporary mitigation is narrow, documented, and easy to roll back. Avoid sweeping firewall or package changes unless you have tested the business impact.
Prepare patching as a controlled change
When the fixed packages arrive, patch quickly but not blindly. A production server still needs backup confidence, service restart awareness, dependency checks, and a rollback path. The advisory should accelerate disciplined maintenance, not replace it.
- Confirm backups: verify recent backups for application files, databases, configuration, and secrets before applying updates.
- Check restart impact: identify which services, containers, or nodes must restart for the fix to take effect.
- Stage when possible: test the patch on a non-production server or one low-risk node first.
- Schedule the window: notify stakeholders if web apps, dashboards, databases, or background jobs may be interrupted.
- Record versions: capture before-and-after package versions and the advisory identifier in your change notes.
Some Linux updates are installed but not fully active until a service or host restarts. Include reboot-required checks in your post-patch verification so the team does not assume remediation is complete too early.
Turn the advisory into a reusable monitoring habit
The best outcome from a security advisory is not just one patched package. It is a better routine for noticing exposure, drift, and missing maintenance earlier next time. That is the practical value of linux server monitoring for small businesses: it turns emergency questions into recurring checks.
- Weekly security summary: pending updates, reboot requirements, exposed ports, failed logins, and certificate status.
- Package watch list: important runtimes, web servers, database packages, XML parsers, language frameworks, and vendor add-ons.
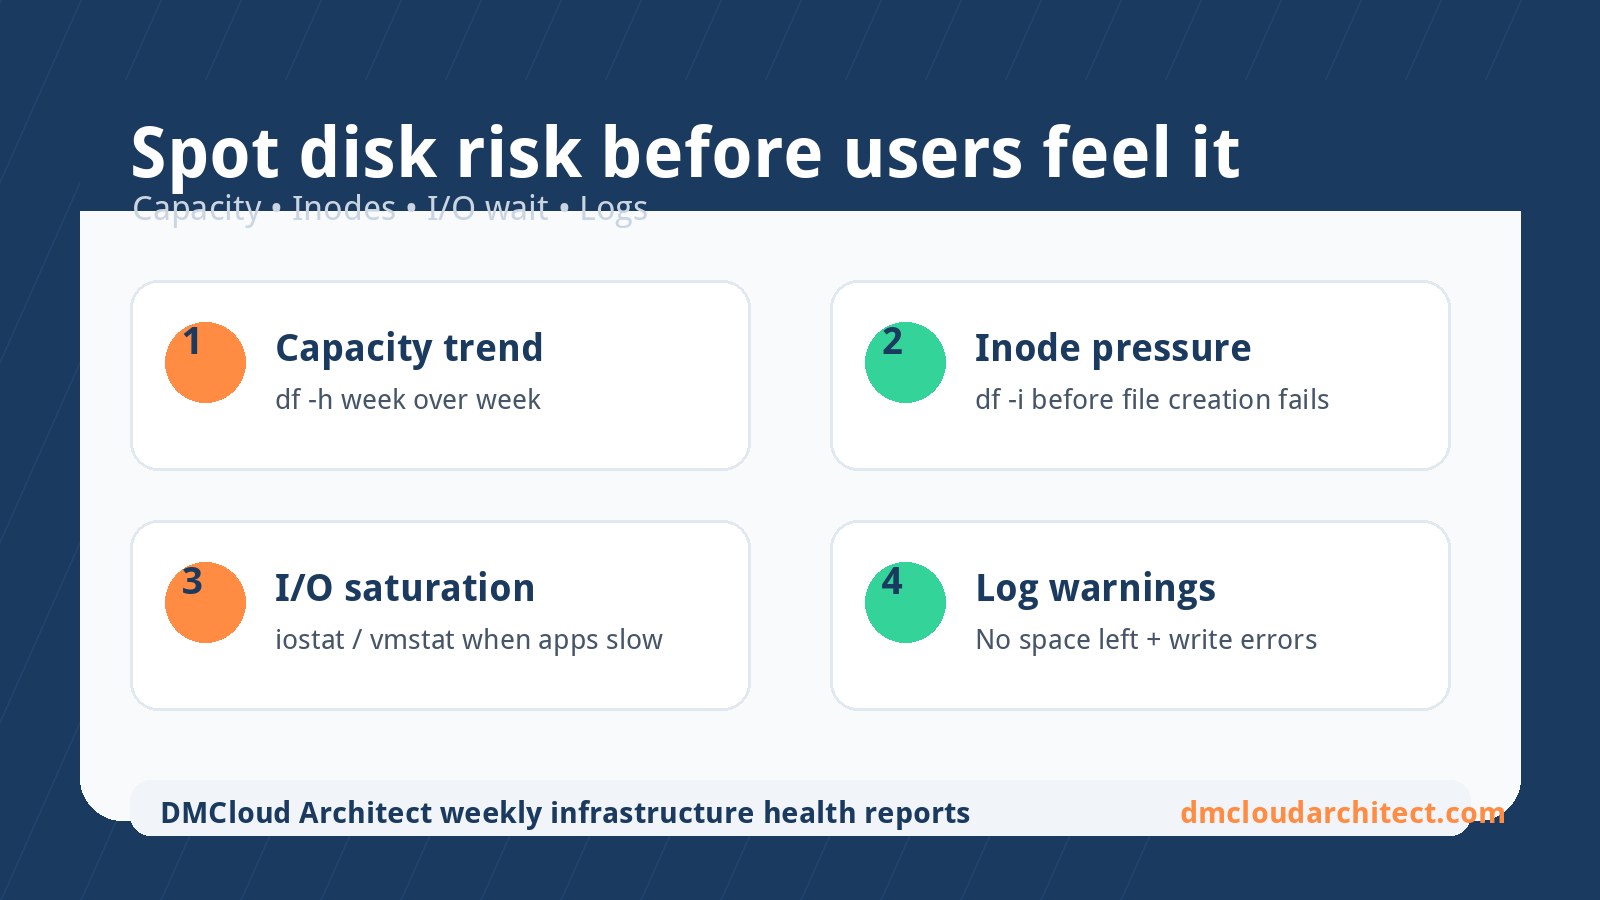
- Growth and log trends: disk usage, log volume, error spikes, and unusual outbound traffic patterns.
- Exception tracking: servers that could not be patched, mitigations still in place, and owners for follow-up.
- Business context: one plain-language sentence explaining what each risk means for customers or operations.
A dashboard is useful only if somebody reads it and understands what changed. A concise report with trends and recommended actions is often a better fit for lean teams.
High-risk Linux advisory response checklist
- Read the official vendor advisory and capture affected versions, workarounds, and fix status.
- Inventory servers, packages, services, containers, and public endpoints that may be affected.
- Review logs for suspicious XML, schema, file path, URL, localhost, private network, and parser-error patterns.
- Check outbound network paths from application servers and block unnecessary access to sensitive internal destinations.
- Disable or restrict unused risky features such as unauthenticated uploads or unused XML processing.
- Verify backups, rollback options, restart requirements, and maintenance windows before patching.
- Apply vendor fixes promptly once available, then confirm active package versions and service restarts.
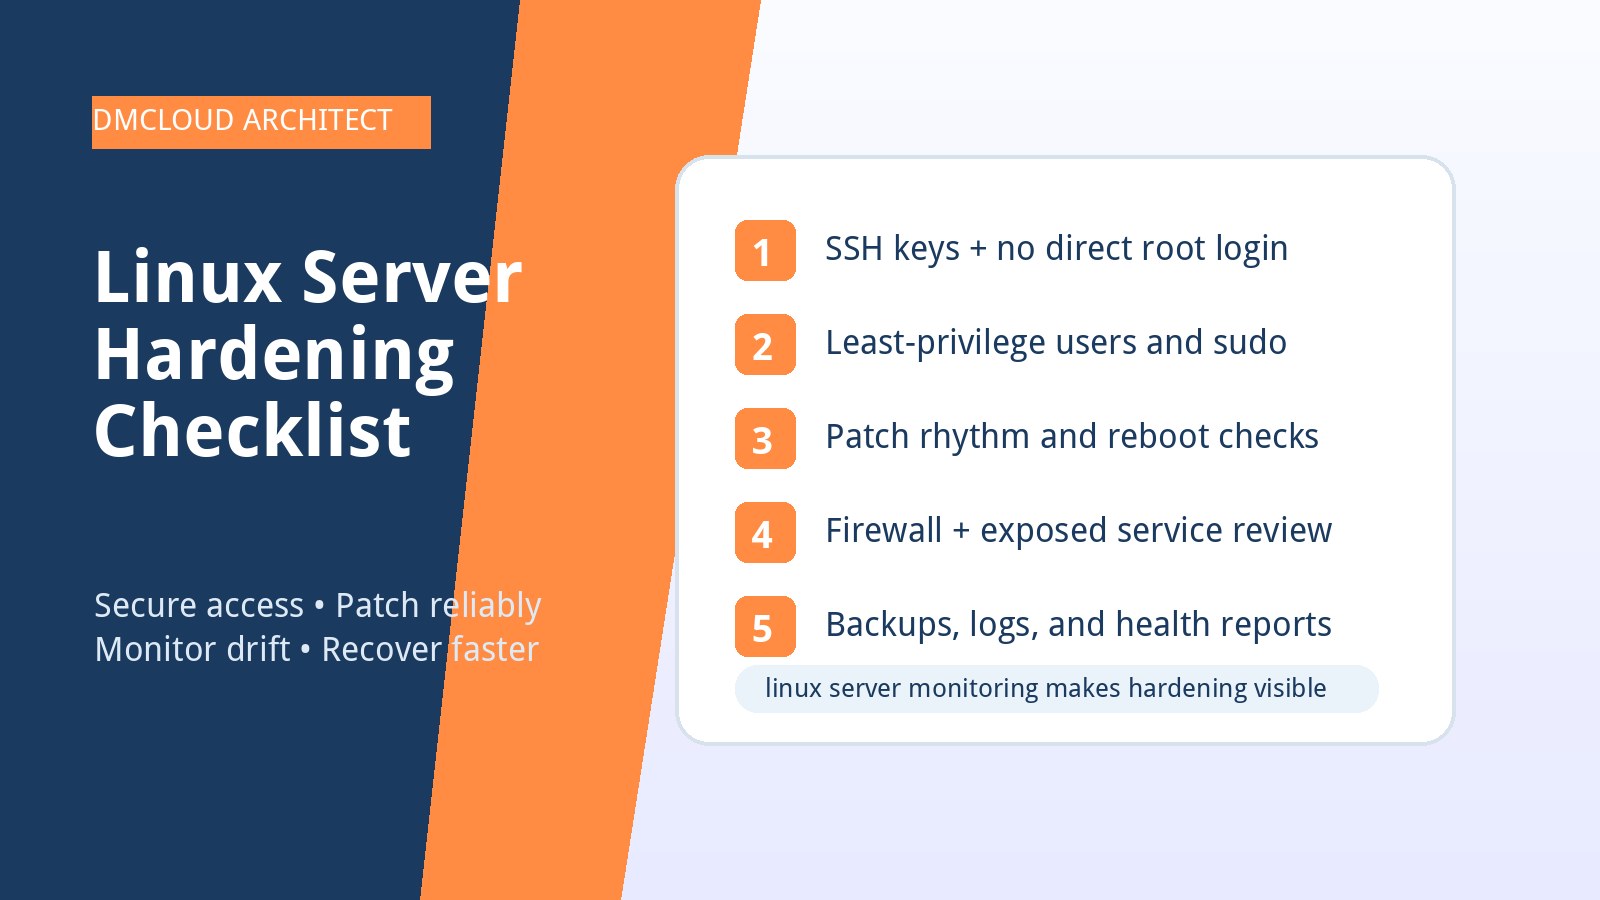
- Add the lessons learned to your recurring server health report so the next advisory is easier to triage.
Security advisories will keep arriving. The sustainable response is a repeatable checklist, accurate server inventory, visible logs, and a maintenance routine that turns urgent headlines into controlled action.
Want weekly infrastructure health checks without dashboard fatigue?
DMCloud Architect sends Linux and MySQL infrastructure health reports directly to your inbox, so you can spot risks early without adding another monitoring dashboard to watch.
Get the free starter plan for weekly infrastructure health reports.