A newly provisioned Linux server often feels “done” when SSH works, the application starts, and the first smoke test passes. In practice, that is only the beginning. The most useful time to audit a server is right after setup, before drift, emergency changes, and undocumented fixes make the environment harder to understand.
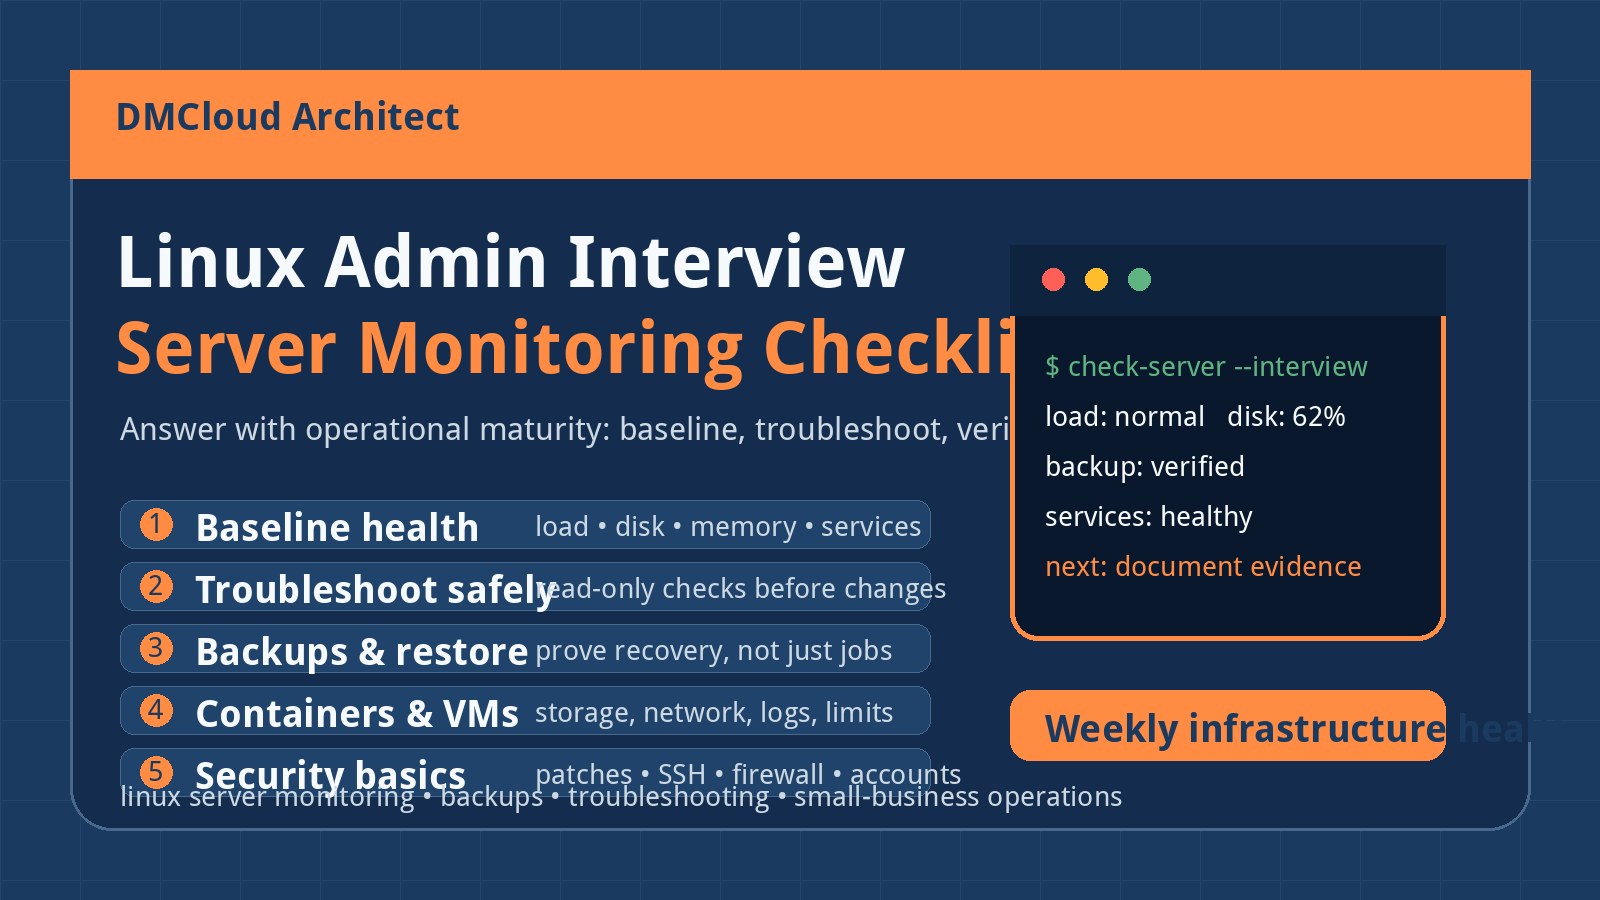
This checklist is for developers, small business owners, and hands-on operators who need a practical baseline rather than a heavyweight compliance exercise. It focuses on the checks that prevent common surprises: unclear access, missing updates, unknown services, weak backup evidence, fast disk growth, noisy logs, and absent linux server monitoring. Use it after a fresh build, a migration, a vendor handoff, or any time you inherit a server and need confidence quickly.
Start with ownership, purpose, and the rollback path
Before running commands, write down what the server is supposed to do and who owns the major decisions. This sounds basic, but many small business incidents become worse because nobody knows whether a service is still required, which database is authoritative, or who can approve downtime.
- Business purpose: list the applications, websites, databases, scheduled jobs, and integrations the server supports.
- Owner and escalation: record the technical owner, business contact, hosting provider, and vendor support path.
- Change window: note when restarts, package updates, and maintenance are least disruptive.
- Rollback plan: confirm whether snapshots, backups, infrastructure-as-code, or rebuild documentation exist.
- Known dependencies: capture DNS, SMTP, payment gateways, object storage, VPNs, API credentials, and external databases.
The goal is not perfect documentation on day one. The goal is to avoid treating an unknown production server like a disposable test machine.
Check login access without weakening it
Access review should be early because every later step depends on safe, accountable administration. Confirm that authorized people can get in, but also remove accidental exposure before the server becomes a target.
- SSH configuration: confirm the listening port, allowed users or groups, key-based access, root login policy, and password authentication setting.
- Sudo access: review who can become root and whether shared admin accounts are being used unnecessarily.
- Stale users: look for former contractors, default accounts, test accounts, and unused service users with shells.
- Failed logins: inspect recent authentication failures so brute-force attempts are visible before they become background noise.
- Emergency access: verify the provider console or break-glass process, especially before disabling any login method.
Do not lock down access blindly. A safer pattern is to verify your current session, open a second session for testing, document the change, and only then remove a risky login path.
Verify patch status and reboot requirements
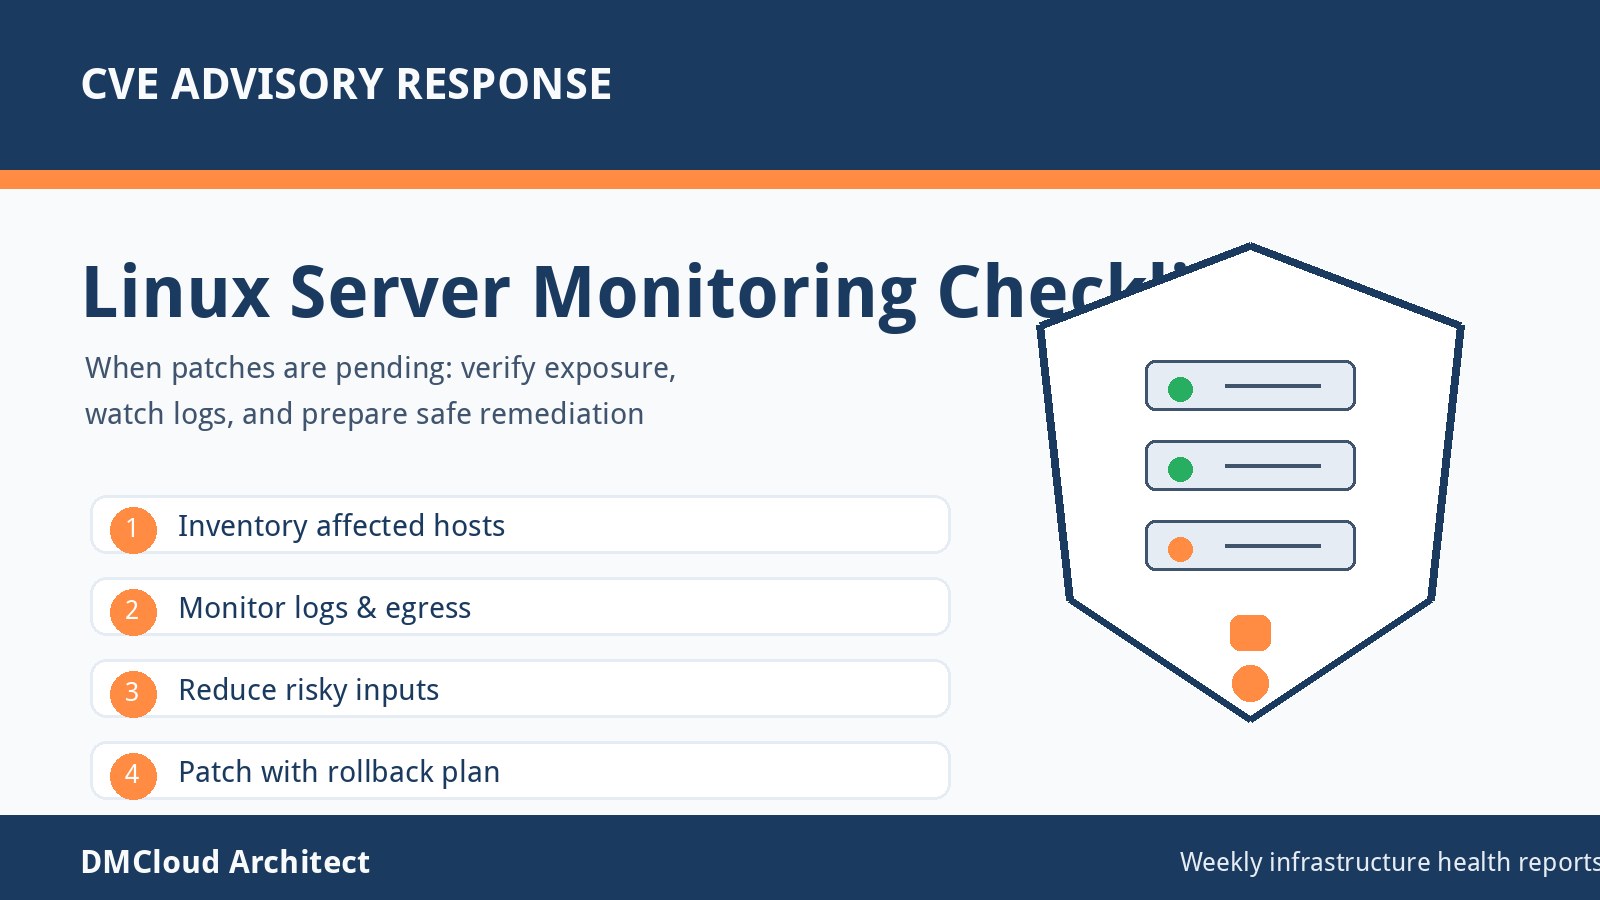
A server can pass an application test while still waiting on kernel updates, library patches, or a reboot. Check package state early, but separate observation from action. In a business environment, updates still need timing, backup confidence, and rollback awareness.
- Package updates: identify security updates and regular updates separately where the distribution supports it.
- Reboot needed: check whether the kernel, libc, or other core packages require a restart to finish remediation.
- Repository sources: confirm expected repositories are enabled and unsupported third-party repos are not silently controlling critical packages.
- Automatic updates: note whether unattended updates are enabled, disabled, or only partially configured.
- Maintenance timing: schedule disruptive updates instead of applying them mid-day because the checklist found them.
This is also a good place to record the operating system version, kernel version, and lifecycle dates. A clean server setup is much less useful if the distribution reaches end-of-life in a few months.
Inventory services, ports, and scheduled jobs
After setup, the server should have a short, explainable list of running services. If nobody can explain a listening port or cron job, it deserves investigation before it becomes part of the permanent baseline.
- Running services: review enabled systemd units and distinguish required services from leftovers.
- Listening ports: compare open ports with the expected application, database, SSH, monitoring, and web services.
- Firewall rules: make sure the firewall allows what the business needs and blocks what it does not.
- Cron and timers: inspect root and application user schedules, including backups, imports, reports, renewals, and cleanup scripts.
- Service restart behavior: confirm important services restart after boot and after failure where appropriate.
Small businesses often discover old scripts during incidents. Documenting scheduled jobs up front makes later troubleshooting much faster because you can connect spikes, emails, exports, and file changes to a known process.
Baseline CPU, memory, disk, and growth risks
Initial resource checks are not just about whether the server is overloaded today. They establish a baseline for future linux server monitoring. Without that baseline, next month’s “normal” CPU load, database size, or log volume is just a guess.
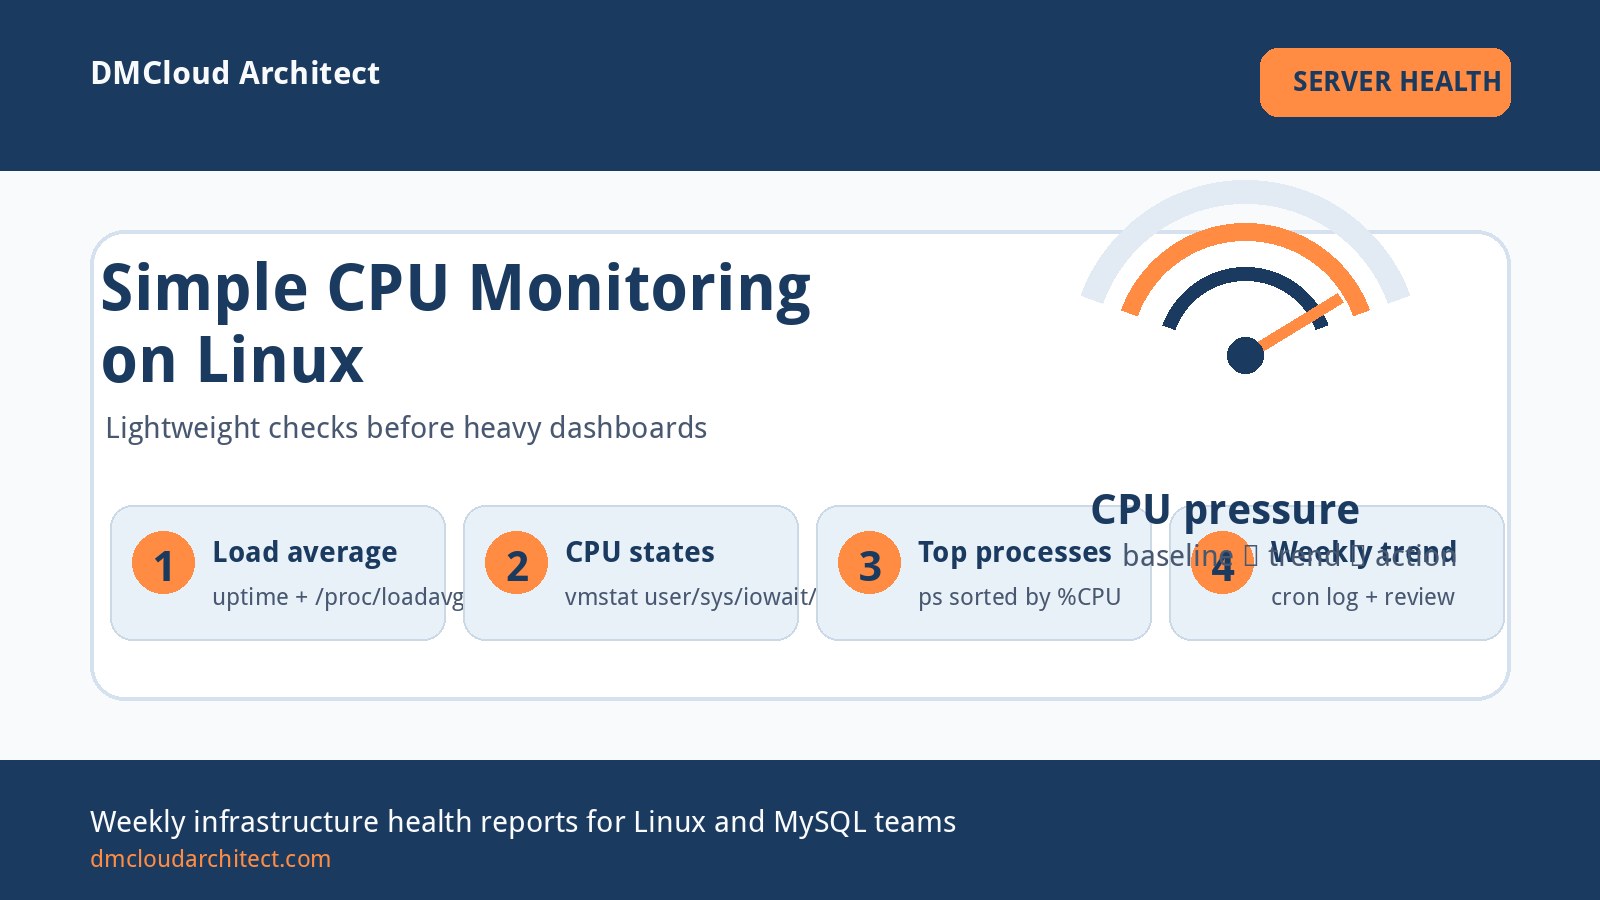
- CPU and load: record current load average, CPU usage, top processes, and whether I/O wait is present.
- Memory: check available memory, swap use, large processes, and out-of-memory events in system logs.
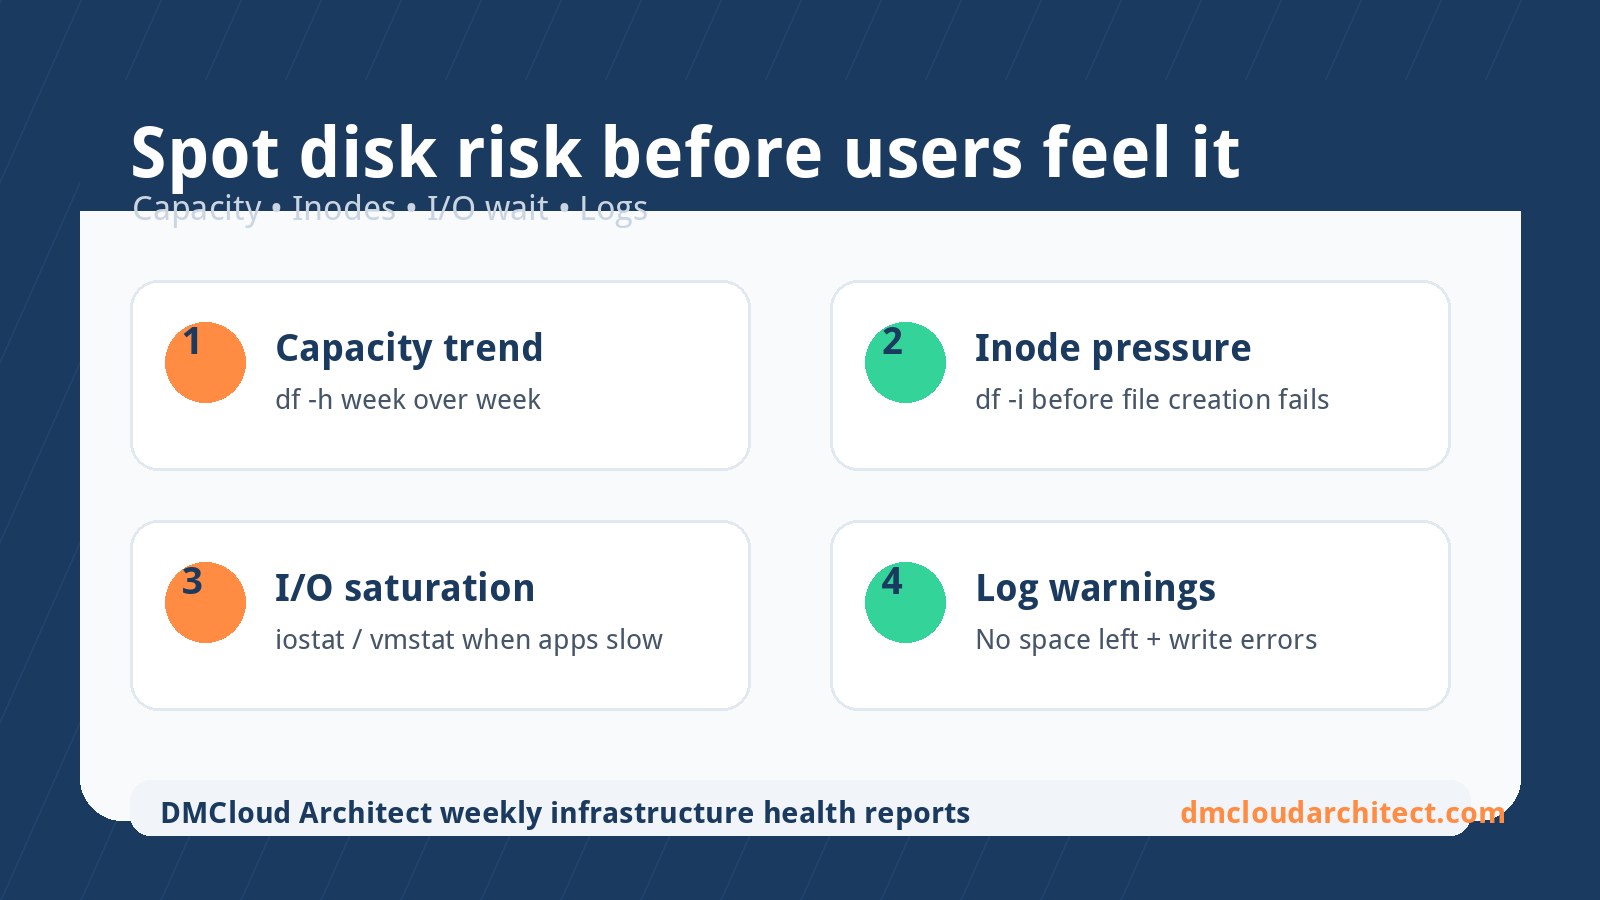
- Disk usage: capture filesystem usage, inode usage, mount points, and unusually large directories.
- Growth hotspots: identify databases, uploads, logs, caches, backups, and temporary folders likely to grow.
- Capacity threshold: decide when warnings should trigger, such as 80% disk usage or a fast week-over-week increase.
Disk growth deserves special attention. A server can move from healthy to urgent quickly when logs, database binary logs, uploads, or backup files grow unnoticed. A weekly trend report is often more useful than a one-time “disk is fine” note.
Prove backups exist and can be restored
Backup configuration is not the same as backup confidence. During an initial audit, verify what is backed up, where it goes, how often it runs, how long it is retained, and how you would restore it. If you cannot describe the restore path, the backup is still an assumption.
- Scope: confirm whether backups include application files, uploads, configuration, databases, certificates, and secrets needed for recovery.
- Schedule: review the last successful run and the next expected run.
- Destination: check whether backups are local only, off-server, immutable, encrypted, or stored with the same credentials as production.
- Retention: make sure the retention window matches the business risk, not just available disk space.
- Restore test: perform or schedule a small restore test to a safe location and document the result.
For database-backed applications, include both logical backup checks and consistency considerations. A file copy of a live database directory may not be enough if the application cannot recover cleanly from it.
Review logs before alerts train people to ignore them
Logs are most valuable when you know what normal looks like. A new server audit should capture recurring errors, failed services, authentication failures, kernel messages, application exceptions, and certificate renewal warnings before they become accepted background noise.
- System logs: look for failed units, repeated kernel warnings, OOM events, disk errors, and time synchronization problems.
- Application logs: identify recurring stack traces, slow requests, authentication failures, and dependency errors.
- Web server logs: review 4xx/5xx patterns, unexpected bots, upload failures, and proxy errors.
- Database logs: check failed logins, slow queries, replication warnings, crash recovery, or storage pressure.
- Noise level: decide which warnings need fixing, which need monitoring, and which are harmless enough to document.
The best alerting starts with this kind of review. You do not want every warning to page someone, but you also do not want repeated failures to hide in plain sight.
Turn the audit into a lightweight monitoring routine
The initial audit should not live as a one-time checklist in a forgotten folder. Convert the findings into a simple monitoring routine that someone will actually review. For many small teams, that means a concise weekly report with trends, exceptions, and recommended actions.
- Weekly health summary: CPU/load trends, memory pressure, disk growth, uptime, failed services, and backup age.
- Security signals: pending updates, exposed ports, failed logins, stale accounts, and certificate status.
- Change notes: package updates, deploys, configuration changes, and new scheduled jobs.
- Action list: one or two clear recommendations instead of a giant dashboard nobody opens.
- Business context: note what each risk means for customers, revenue, or internal operations.
This is where linux server monitoring becomes practical rather than theoretical. The point is not to collect every metric forever. The point is to make risks visible early enough that they can be handled during normal business hours.
A quick initial audit checklist
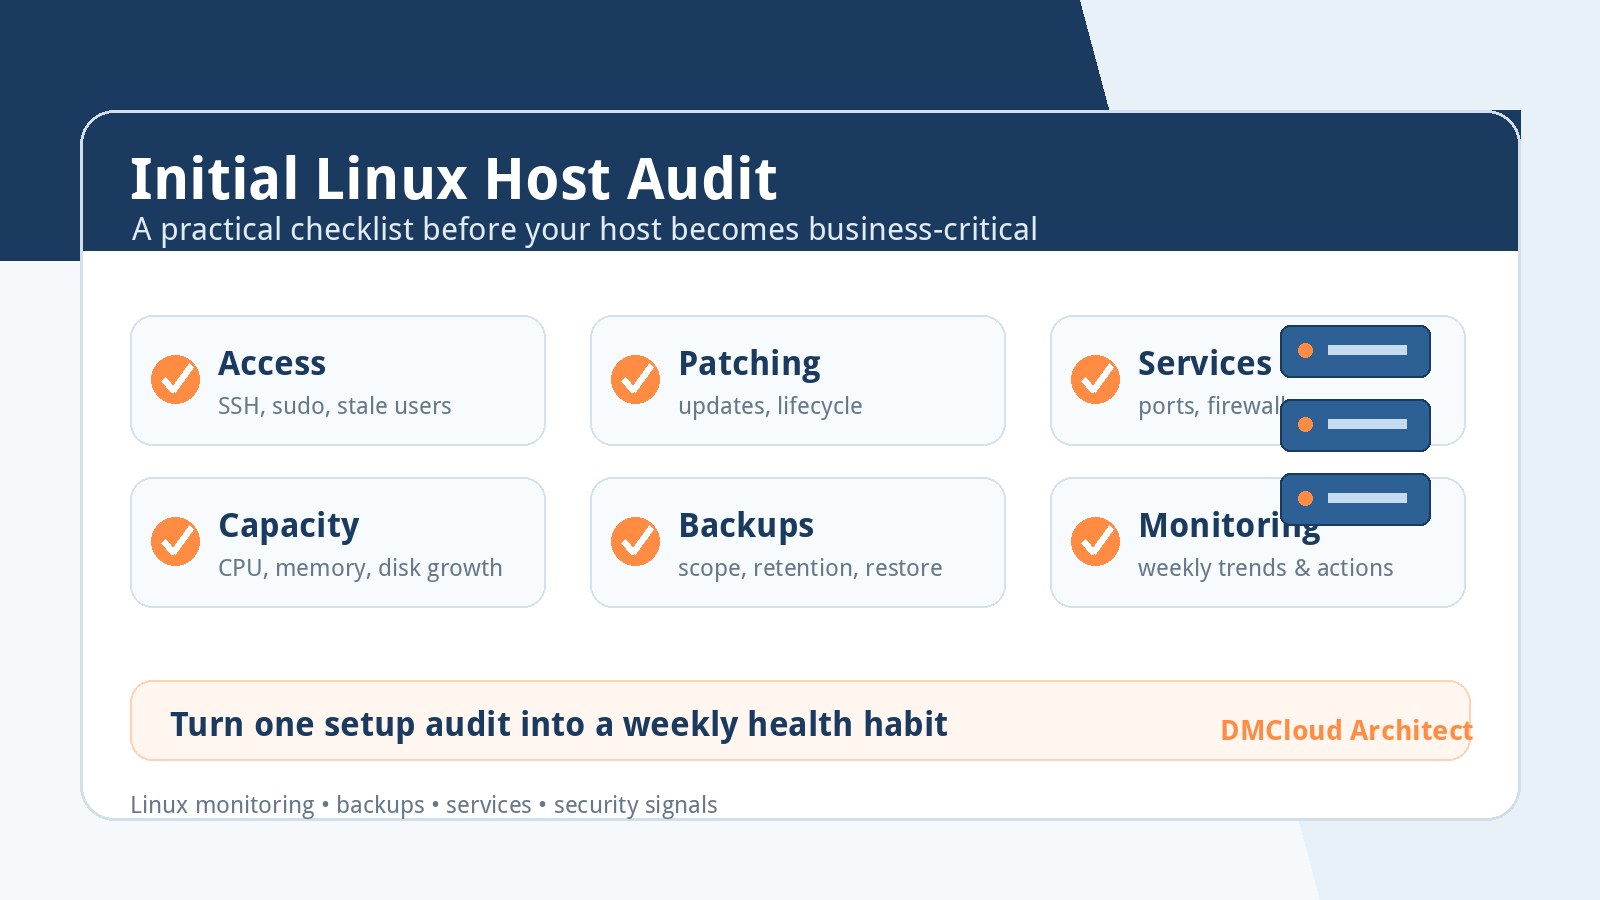
- Document the server purpose, owner, dependencies, and rollback path.
- Verify SSH, sudo, user accounts, failed logins, and emergency access.
- Check package update status, reboot requirements, repositories, and OS lifecycle.
- Inventory enabled services, listening ports, firewall rules, cron jobs, and timers.
- Record CPU, memory, disk, inode, and growth baselines.
- Confirm backup scope, schedule, destination, retention, and restore evidence.
- Review system, application, web, and database logs for recurring errors.
- Create a weekly monitoring habit so the baseline stays useful.
A good server audit does not need to be complicated. It needs to be repeatable, honest, and connected to business impact. If you know what the server is for, who owns it, how it is accessed, what is running, how it is backed up, and which trends are changing, you are already ahead of many preventable outages.
Want weekly infrastructure health checks without dashboard fatigue?
DMCloud Architect sends Linux and MySQL infrastructure health reports directly to your inbox, so you can spot risks early without adding another monitoring dashboard to watch.
Get the free starter plan for weekly infrastructure health reports.