Disk alerts often arrive too late for a calm response. By the time a filesystem is at 98%, a database cannot write temporary files, backups start failing, or a log-heavy application suddenly takes down the box. A better habit is to identify disk issues early with a short set of Linux checks that reveal both capacity risk and storage pressure.
Why disk problems sneak up on small teams
Storage failures do not always look like a broken disk. In many small business environments, the first warning is a backup directory growing quietly, a chatty application log, a temporary import file that never gets removed, or a database table that expands faster than expected. These changes may not trigger a critical alert until the available space is already too low.
The goal is not to build a huge observability platform on day one. The goal is to notice trend direction early enough to schedule cleanup, resize a volume, rotate logs, or investigate an application before users feel the impact.
Watch capacity trends, not just today’s percentage
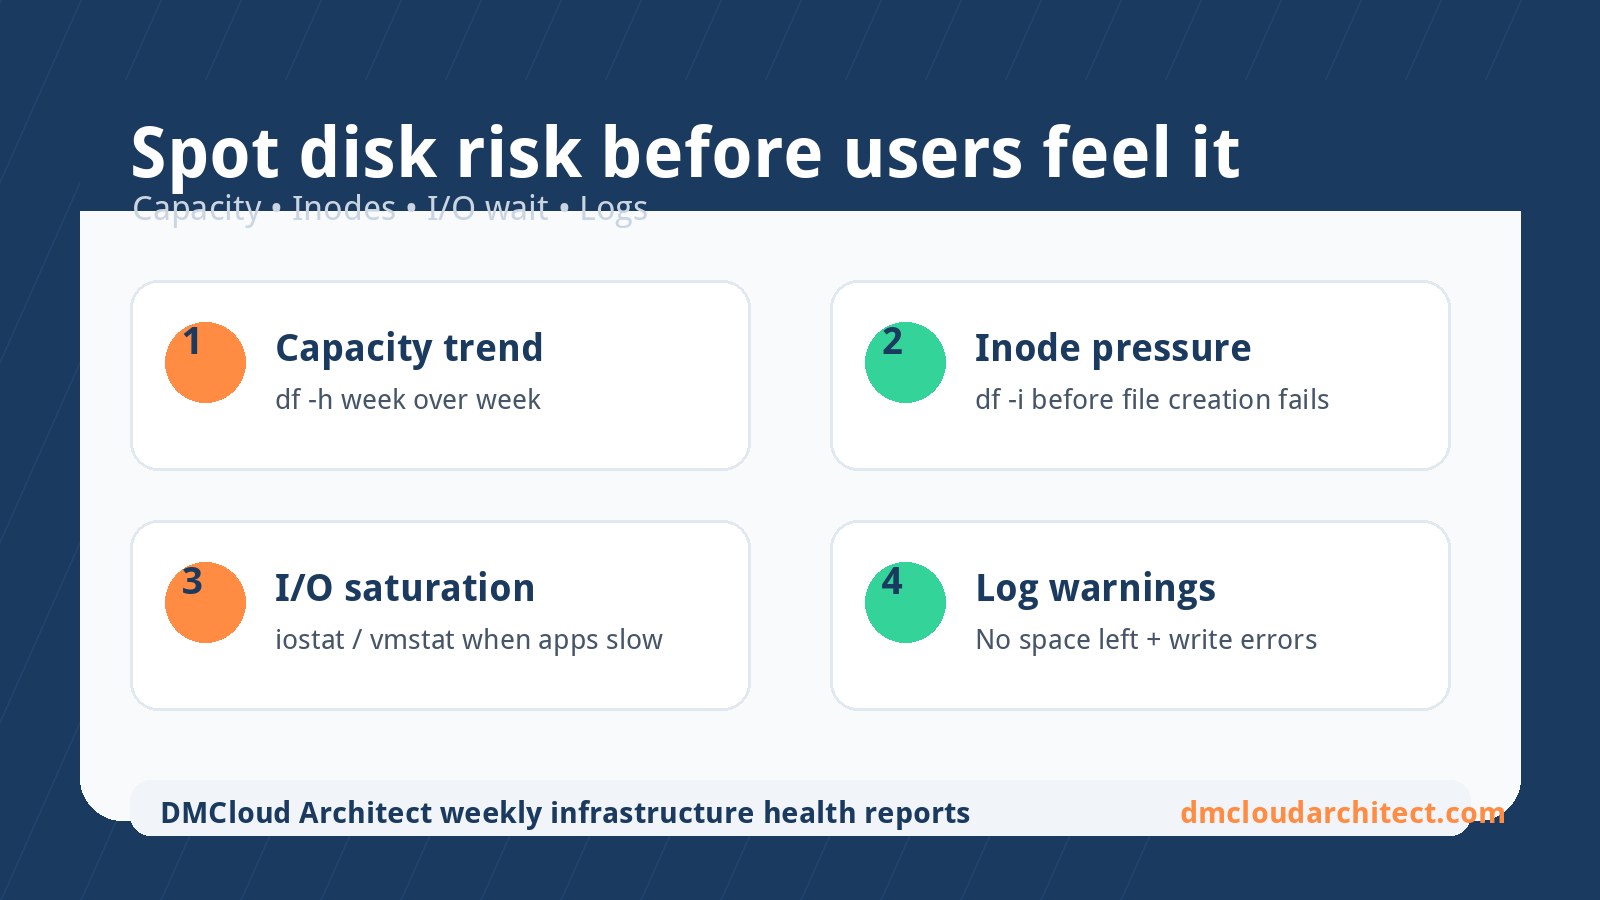
The familiar df -h command is still a good starting point, but a single reading can be misleading. A server at 72% usage may be healthy if it grows by 1% per month. The same server may be in trouble if it gained 12% in a week after a new deployment.
Record the used percentage, available space, and mount point for every important filesystem. Then compare the current reading with last week’s value. That trend makes it easier to detect disk full before failure instead of reacting after the application has already stopped writing.
Do not forget inode usage
A filesystem can fail with plenty of gigabytes free if it runs out of inodes. This often happens on servers that create many small cache files, mail queue files, session files, or application artifacts. Use df -i alongside df -h so inode exhaustion is visible in the same weekly review.
If inode usage is climbing, look for directories with unusually high file counts. Cleaning a few old cache trees or fixing a runaway job can prevent a confusing outage where the disk looks spacious but new files still cannot be created.
Check I/O pressure before blaming CPU or memory
Disk saturation can make a server feel slow even when capacity looks fine. If users report delays, backups run longer, or database queries suddenly drag, check I/O wait and disk activity. Tools such as iostat, vmstat, and iotop can show whether processes are waiting on storage rather than compute.
For lightweight monitoring, capture a short snapshot during business hours and another during scheduled maintenance windows. Large differences between normal and backup periods can point to jobs that need throttling, rescheduling, or separate storage.
Use logs as an early warning system
Linux and application logs often mention storage trouble before a human notices a failed workflow. Search for messages such as No space left on device, read-only filesystem warnings, I/O errors, failed log rotations, and database temporary file failures. A weekly grep across system and application logs is simple, but it can reveal recurring risk before it becomes an incident.
Log growth itself is also a signal. If /var/log expands quickly, review rotation policies, compression, and retention. A misconfigured verbose log can consume space faster than normal business data.
A practical weekly disk health checklist
- Run
df -hand flag important filesystems above your warning threshold. - Run
df -iand review inode usage for cache-heavy or file-heavy workloads. - Compare capacity and inode readings with the previous weekly snapshot.
- Review top disk consumers with
dufor directories that changed unexpectedly. - Check I/O wait or disk activity if the server feels slow but CPU and memory look normal.
- Search logs for storage, filesystem, backup, and database write errors.
- Document whether the right action is cleanup, retention tuning, volume expansion, or application investigation.
Set thresholds that match the workload
A generic 90% warning is useful, but it is not enough for every server. A large archive volume may be safe at 88% if growth is predictable. A database volume may need attention at 75% if weekly growth is fast or if emergency expansion requires a maintenance window.
Use two levels: a warning threshold that prompts review and a critical threshold that requires action. For example, a small business file server might warn at 80% and escalate at 90%, while a database server with fast growth may warn earlier. The trend matters as much as the absolute number.
Turn checks into a repeatable report
The best disk full warning Linux teams can use is the one they actually review. A cron job that captures disk usage into a weekly note, ticket, or email is more valuable than a dashboard nobody opens. Include the current values, week-over-week change, unusual directories, and a short recommendation.
This lightweight report gives owners a decision point: clean old artifacts, adjust log retention, archive stale data, or plan a resize. It also creates a history that makes future capacity conversations easier because the evidence is already collected.
What to do when risk appears
When a trend shows storage risk, resist the urge to delete random files in a panic. First identify the largest changed directories, confirm whether the data is expected, and check backups before removing anything important. Then choose a durable fix: log rotation, retention policy changes, application cleanup, database maintenance, or storage expansion.
If the same issue repeats, automate the check and add it to the normal health report. Repeated manual cleanup usually means the server needs a better retention policy or a clearer ownership process.
Summary
To prevent disk full outage server incidents, watch capacity, inode usage, I/O pressure, and storage-related logs together. Compare those readings over time so small changes become visible before they turn into downtime. A simple weekly review gives developers and small business owners enough context to act early without living inside monitoring dashboards.
Want a second set of eyes on your Linux and MySQL infrastructure trends? Get the free starter plan for weekly infrastructure health reports.