If you run a small Linux server, CPU problems rarely announce themselves with a neat warning. They usually show up as a checkout page that feels slow, a backup job that starts missing its window, or a database query that suddenly takes longer during business hours. A simple scheduled check can give you a useful early signal before those symptoms become urgent.
The goal is not to replace a full monitoring platform. The goal is to collect enough CPU evidence every few minutes to answer three practical questions: is the server busy, is the pressure sustained, and which process was active when the pressure started? For many small teams, that history is the difference between guessing and fixing the right thing.
What CPU data is worth collecting?
Start with a short list. Load average tells you whether runnable work is backing up. CPU idle percentage tells you whether the processor is actually saturated. A quick process snapshot tells you which workload was consuming time at the moment of the sample.
For a single small server, the most useful fields are usually:
- Timestamp: always log in a consistent timezone, preferably UTC or the server's operating timezone.
- 1, 5, and 15 minute load average: this helps separate a quick spike from a sustained trend.
- CPU idle percentage: low idle time for several samples in a row is more concerning than one busy moment.
- Top CPU processes: collect the process name, PID, and CPU percentage so the log is actionable.
- Core count: load average only makes sense when compared with available CPU cores.
A lightweight bash script for scheduled checks
Create a small script that writes one structured line per run. The example below avoids heavy dependencies and works well as a starting point on common Linux distributions.
#!/usr/bin/env bash
set -euo pipefail
LOG_DIR="/var/log/server-health"
LOG_FILE="$LOG_DIR/cpu-samples.log"
mkdir -p "$LOG_DIR"
TS=$(date -Iseconds)
CORES=$(nproc)
LOAD=$(awk '{print $1","$2","$3}' /proc/loadavg)
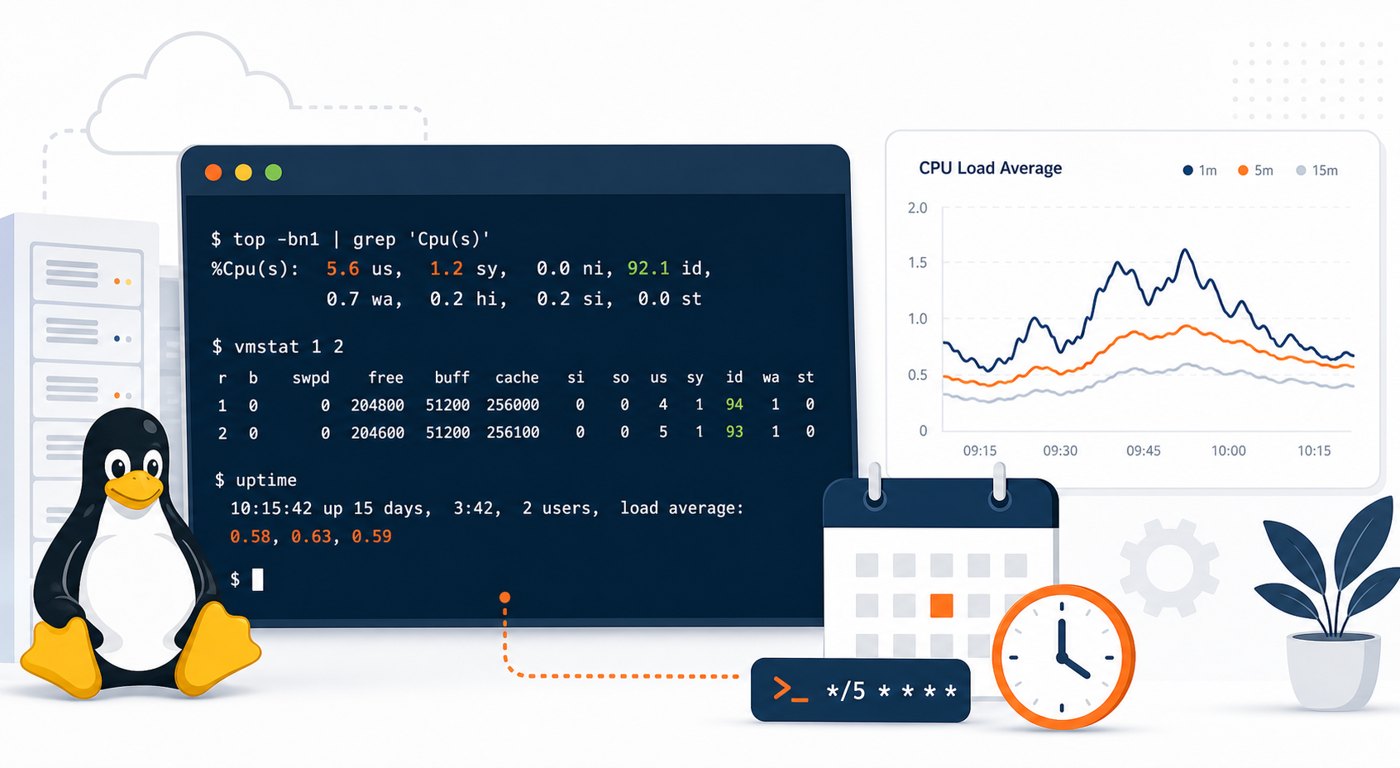
CPU_IDLE=$(top -bn1 | awk -F'id,' '/Cpu\(s\)/ { split($1, a, ","); print a[length(a)] }' | xargs)
TOP_PROCESSES=$(ps -eo pid,comm,%cpu --sort=-%cpu | head -n 6 | tail -n 5 | tr '\n' ';')
printf '%s cores=%s load=%s cpu_idle="%s" top="%s"\n' \
"$TS" "$CORES" "$LOAD" "$CPU_IDLE" "$TOP_PROCESSES" >> "$LOG_FILE"
Save it as /usr/local/sbin/cpu-sample.sh, then make it executable:
sudo chmod 750 /usr/local/sbin/cpu-sample.sh
sudo mkdir -p /var/log/server-health
Run it manually once before adding a schedule. If the command writes a line to /var/log/server-health/cpu-samples.log, you have a working baseline.
Schedule the check with cron
For most small production servers, a five-minute interval is a good balance. It is frequent enough to catch repeated pressure but not so frequent that the monitoring itself becomes noisy.
*/5 * * * * /usr/local/sbin/cpu-sample.sh >/dev/null 2>&1
If the server is extremely small, start with every ten or fifteen minutes. If you are investigating an active issue, temporarily sample every minute for a short window, then return to a normal interval after the incident is understood.
Use thresholds as prompts, not panic buttons
A common mistake is treating one high sample as an emergency. CPU monitoring is more useful when it highlights patterns. A one-minute load spike during a deployment may be normal; a 15-minute load average that stays above the number of CPU cores deserves attention.
As a simple rule of thumb, review the server when:
- The 15-minute load average is consistently near or above the CPU core count.
- CPU idle time stays very low across multiple samples.
- The same process appears at the top of the list during several busy windows.
- Spikes align with cron jobs, backups, report generation, imports, or traffic peaks.
These thresholds should start conversations. They help you ask better questions: did a new background job overlap with backups, did a database query change, or did traffic grow beyond the current instance size?
Keep logs small and readable
Any scheduled log needs rotation. Without it, a helpful file can slowly become a disk-space problem. Add a simple logrotate rule such as:
/var/log/server-health/cpu-samples.log {
    weekly
    rotate 8
    compress
    missingok
    notifempty
    create 0640 root root
}
This keeps several weeks of compressed history while preventing the log from growing forever. If you are collecting data for a weekly operations review, eight weeks gives you enough trend context to spot recurring pressure.
Turn raw samples into weekly decisions
The real value of CPU history is not the log line itself. The value is the decision it supports. Once a week, summarize the busiest windows, the most frequent top processes, and whether load is trending up or down.
For example, a useful weekly note might say: "CPU load was healthy most of the week, but the 15-minute load average exceeded four cores during nightly imports on Tuesday and Thursday. The top process was the reporting worker, so the next action is to move that job outside the backup window." That kind of finding is small, practical, and much easier to act on than a dashboard full of unexplained spikes.
When cron-based checks are enough
This approach is a good fit when you need basic visibility, have only a few servers, or want a backup signal that continues working even if a larger monitoring stack is unavailable. It is also useful for developers managing client infrastructure where simple evidence matters more than complex tooling.
It is not a complete incident response system. If you need real-time paging, multi-node dashboards, anomaly detection, or detailed application traces, use a dedicated monitoring platform. Even then, simple scheduled CPU samples can still provide a helpful independent trail when diagnosing long-running performance issues.
A practical next step
Pick one low-risk server and collect CPU samples for a week. At the end of the week, look for repeated busy periods and match them against deployments, backups, imports, traffic peaks, and database maintenance. If you find the same pattern twice, you have a useful optimization target.
Small, steady visibility beats occasional panic. A scheduled CPU check gives you just enough history to notice capacity pressure early, explain performance changes clearly, and decide whether to tune a job, resize a server, or investigate an application bottleneck.
Want weekly infrastructure health checks without dashboard fatigue?
DMCloud Architect sends Linux and MySQL infrastructure health reports directly to your inbox, so you can spot risks early without adding another monitoring dashboard to watch.
Get the free starter plan for weekly infrastructure health reports.