A 200-server Linux fleet sits in an awkward middle ground. It is large enough that scattered logs and hand-built searches are painful, but often too lean for a dedicated observability platform team. That is where choices like Loki, Vector, and Elasticsearch stop being trendy tooling questions and become practical linux server monitoring decisions.
The best answer is rarely “replace everything with one product.” A healthy logging design should control storage growth, keep incident searches fast enough, preserve important context, and avoid making every application team learn a complicated pipeline before they can troubleshoot a production issue.
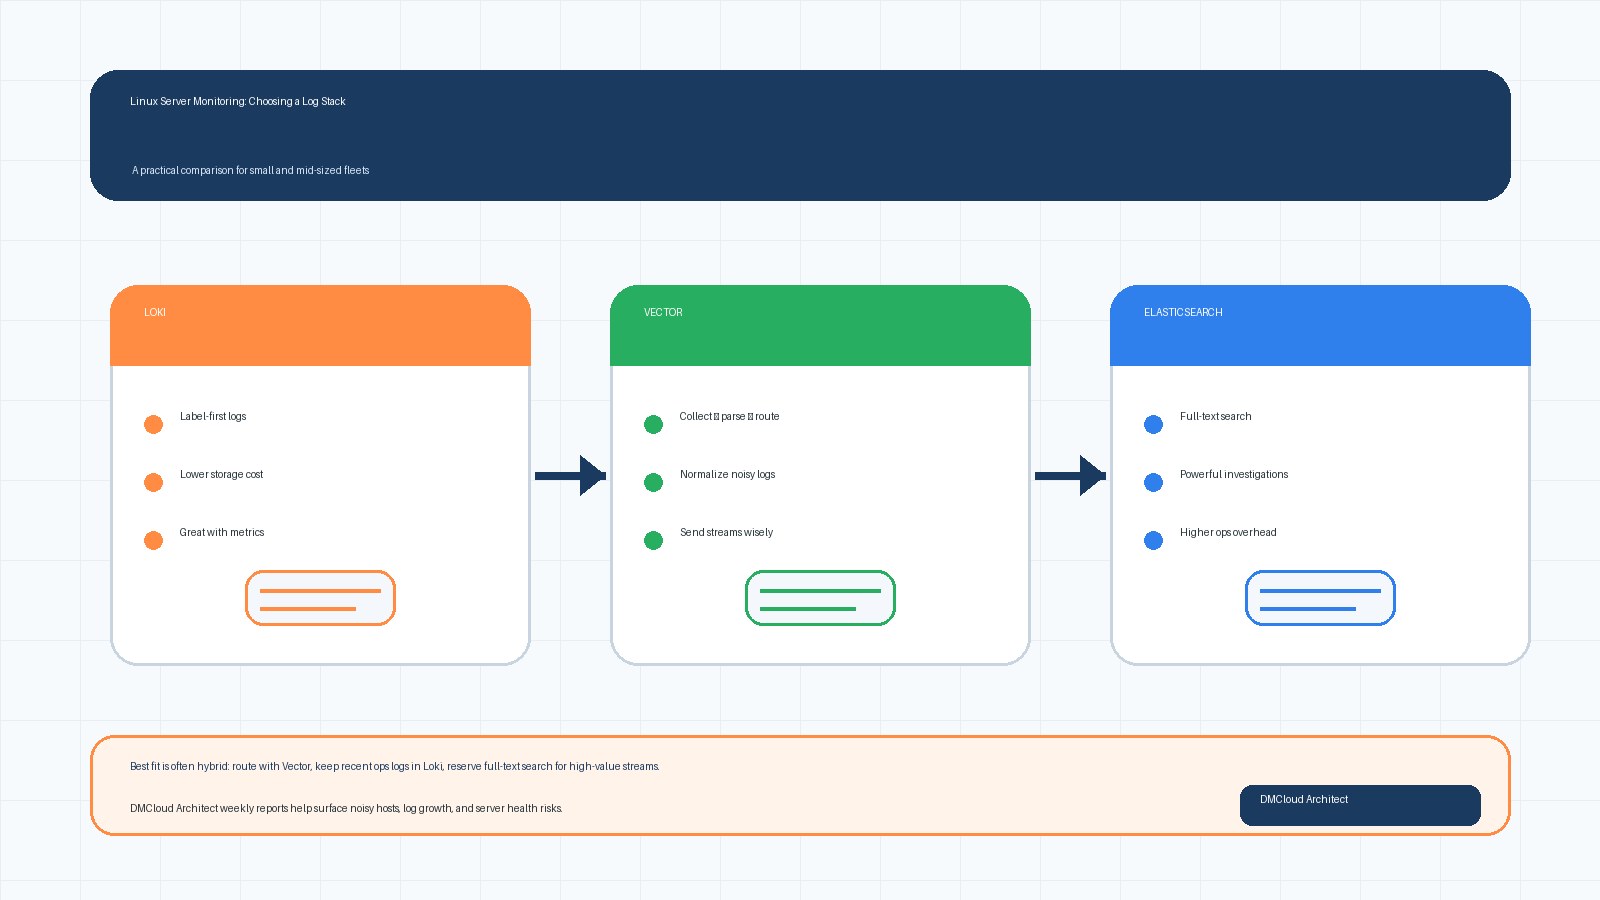
The Core Trade-Off: Search Everything or Structure What Matters
Elasticsearch became popular for centralized logging because it can index and search a lot of text quickly. That power is useful when logs are inconsistent, teams do not know exactly what they will need during an incident, or support workflows depend on broad full-text search.
The trade-off is cost and operations. Full-text indexing increases storage requirements, cluster tuning matters, shard management can become a recurring chore, and retention decisions get expensive as log volume grows. For small teams, the hidden question is not “can Elasticsearch handle it?” but “do we want to operate it as a core platform?”
Loki takes a different approach. Instead of indexing every word, it indexes labels and stores log lines more cheaply. That can make retention easier and reduce infrastructure cost, especially when your services already have useful labels such as environment, host, service, region, and severity. The trade-off is that query habits must change. If teams expect arbitrary full-text searches across months of logs, Loki can feel slower or less flexible than a well-tuned Elasticsearch cluster.
Vector is not a direct replacement for either one. It is a collection, routing, transformation, and delivery layer. Think of it as the log pipeline that can receive messages from servers, parse or enrich them, drop noisy fields, sample low-value logs, and forward different streams to different destinations.
When Elasticsearch Still Makes Sense
Elasticsearch remains a good fit when full-text search is central to your operational workflow. If your team regularly searches arbitrary request IDs, customer names, exception strings, unstructured application messages, or older incidents without knowing which labels to filter first, Elasticsearch can still save time.
It is also useful when you already have stable operational knowledge around the cluster. A system that your team understands, monitors, backs up, and upgrades safely is not automatically bad just because newer options exist. Migration has a cost, and a rushed logging migration can create blind spots during the next outage.
However, Elasticsearch deserves a realistic budget. Include disk, replicas, snapshots, index lifecycle policies, cluster upgrades, heap tuning, mapping problems, and the staff time needed to keep it healthy. If those tasks are crowding out higher-value infrastructure work, it may be time to narrow what goes into Elasticsearch instead of sending every log line there forever.
When Loki Is the Better Default
Loki is attractive when your logs can be queried by labels first and text second. For example, a typical incident search might start with production, one service, one host group, and a short time window. In that pattern, Loki can be efficient because the labels narrow the search before log content becomes important.
It works especially well when teams already use Prometheus-style thinking. If metrics and alerts identify the service, instance, and time window, logs become the next step in the same investigation instead of a giant separate search engine. That makes Loki a natural fit for weekly server health reporting and practical incident review.
The main risk is label design. Too few labels make searches broad and slow. Too many high-cardinality labels, such as user IDs or request IDs, can harm the system. A good Loki deployment needs a simple label policy: environment, service, host or instance group, severity, and maybe region or role. Keep unique identifiers in the log body, not as labels.
Where Vector Fits in the Pipeline
Vector is helpful when the fleet needs cleaner log routing before storage. It can collect from files, journald, syslog, containers, and agents; transform events; add metadata; redact sensitive values; and send different streams to Loki, Elasticsearch, object storage, or another destination.
For a mixed Ubuntu and RHEL fleet, this pipeline role matters. Older systems may produce syslog-style messages, newer services may emit JSON, and different environments may have different retention requirements. Vector lets you normalize some of that variety near the source or at a regional aggregator instead of forcing the storage backend to absorb every inconsistency.
A practical pattern is to use Vector at each server or data center boundary, then route logs by value. Security and application error logs might go to a searchable backend with longer retention. High-volume debug logs might be sampled, shortened, stored cheaply, or retained for a shorter window. Audit logs may need a separate immutable destination.
Centralized, Regional, or Hybrid Collection?
Centralized collection is easiest to understand: every server sends logs to one platform. It simplifies access and search, but it can create network dependency and a single operational bottleneck. If the central endpoint is slow or unavailable, agents need buffering and clear failure behavior.
Regional or per-data-center aggregation adds a middle layer. Servers forward locally, the aggregator buffers and transforms, then it ships to the main backend. This reduces cross-site chatter, gives you a place to apply consistent parsing, and can preserve logs during short central outages.
For many small and mid-sized fleets, a hybrid model is the safest step forward. Keep lightweight agents on servers, use Vector or a similar tool for aggregation and transformation, store recent operational logs in Loki or Elasticsearch, and archive selected streams to cheaper object storage for compliance or later review.
Retention Should Be Designed by Log Value
Storage costs usually grow because retention is treated as one global setting. In reality, not every log stream deserves the same lifetime. Authentication failures, audit trails, deployment events, and payment-related application errors may need longer retention. Verbose debug logs, health check noise, and repetitive successful requests may be useful for days, not months.
Start with three classes. First, critical operational and security logs with longer retention and stronger protection. Second, normal application and system logs with medium retention, usually enough to troubleshoot recent incidents and spot trends. Third, high-volume low-value logs with short retention, sampling, or selective archive.
This simple classification often reduces cost before a full platform migration is required. It also makes linux server monitoring reports more useful because they can focus on signal: error rates, failed services, disk pressure, authentication anomalies, and noisy log sources that need cleanup.
Structured vs. Unstructured Logs: Avoid the Halfway Trap
Structured JSON logs are easier to parse, route, redact, and summarize. They make labels and fields predictable, which helps both Loki and Elasticsearch. The challenge is consistency. If every service invents different field names for host, service, request ID, severity, and trace ID, the logs are technically structured but still operationally messy.
Unstructured logs are not automatically bad. They are often unavoidable for system services and older applications. The key is to avoid pretending they are structured when they are not. Use pipeline transforms for stable patterns, but do not build fragile parsing rules that silently break whenever a package changes its log format.
A good compromise is to standardize new application logs while treating legacy and system logs with lighter parsing. Add server metadata consistently, normalize severity where practical, and preserve the original message so incident responders can still see what actually happened.
A Practical Choice Matrix
Choose Elasticsearch if full-text search is essential, your team already understands cluster operations, and the value of broad investigation outweighs the cost. It is a strong search platform, but it should not be the default dumping ground for every low-value line forever.
Choose Loki if cost-aware retention, label-based investigation, and Prometheus-style workflows match how your team troubleshoots. It is a strong default for many server fleets when alerts and metrics already point responders toward the right service and time window.
Choose Vector when your biggest problem is messy collection, routing, transformation, or retention control. It can also be the first migration step because it lets you improve the pipeline before deciding which storage backend should receive each log stream.
Choose a hybrid when different log types have different jobs. This is often the most realistic answer: Vector for collection and routing, Loki for recent operational logs, Elasticsearch for narrower full-text use cases, and object storage for low-cost archive.
Migration Without Losing Visibility
Do not migrate a logging platform by turning one system off and hoping the next one catches everything. Run both paths for a short period. Compare ingestion counts, dropped events, query examples, alert coverage, and retention behavior. Pick a few recent incidents and confirm the new workflow would have helped your team find the same facts.
Also document operational checks for the logging system itself. Agents should report when they fall behind. Aggregators should expose buffer, error, and retry metrics. Storage backends should be checked for disk pressure, failed writes, slow queries, and retention policy failures. Logging is part of your monitoring system, so it needs monitoring too.
What Weekly Health Reports Should Include
A weekly infrastructure health report can make logging decisions easier by showing trends instead of only incident screenshots. Useful sections include top noisy hosts, growing log volumes, repeated service errors, authentication anomalies, disk usage from log storage, failed agent heartbeats, and retention policy warnings.
For small business owners and lean developer teams, that weekly rhythm is valuable because it creates a simple maintenance loop. You can spot the Elasticsearch index that is growing too fast, the Loki label that is too broad, or the server that stopped forwarding logs before the next outage forces the discovery.
Summary
The practical answer for a growing Linux fleet is to separate collection, routing, search, and retention decisions. Elasticsearch is still valuable for broad search, Loki is often better for cost-aware label-based operations, and Vector is a strong pipeline layer that helps you send the right logs to the right place.
Start by classifying log value, improving metadata, and testing a hybrid path before committing to a full migration. That approach keeps incident response reliable while reducing the operational overhead that made the old logging setup painful in the first place.
If you want a simple weekly view of log volume, noisy hosts, server health, and monitoring risks, use Get the free starter plan for weekly infrastructure health reports and catch small infrastructure issues before they become urgent.