Back to Blog
Chromebook Linux as a Server: Local Wi-Fi Connectivity Checklist

Chromebook Linux as a Server: Local Wi-Fi Connectivity Checklist

   Mariusz Antonik    Automation    5 min read    7 views

Running Node and Express inside the Linux environment on a Chromebook can be a handy way to test an internal tool, prototype an API, or demo a small app without provisioning a cloud server. The confusing part often starts after the app works locally: another laptop or phone on the same Wi-Fi tries to reach the Chromebook's private address and the connection fails. That moment is a useful reminder that linux server monitoring starts with simple reachability checks before it becomes charts, dashboards, or alerts.

This checklist walks through the practical questions to answer when a Chromebook Linux service works on the device but not across the local network. It is written for developers and small business owners who need a calm troubleshooting path, not a deep dive into every ChromeOS networking detail.

First, confirm what is actually listening

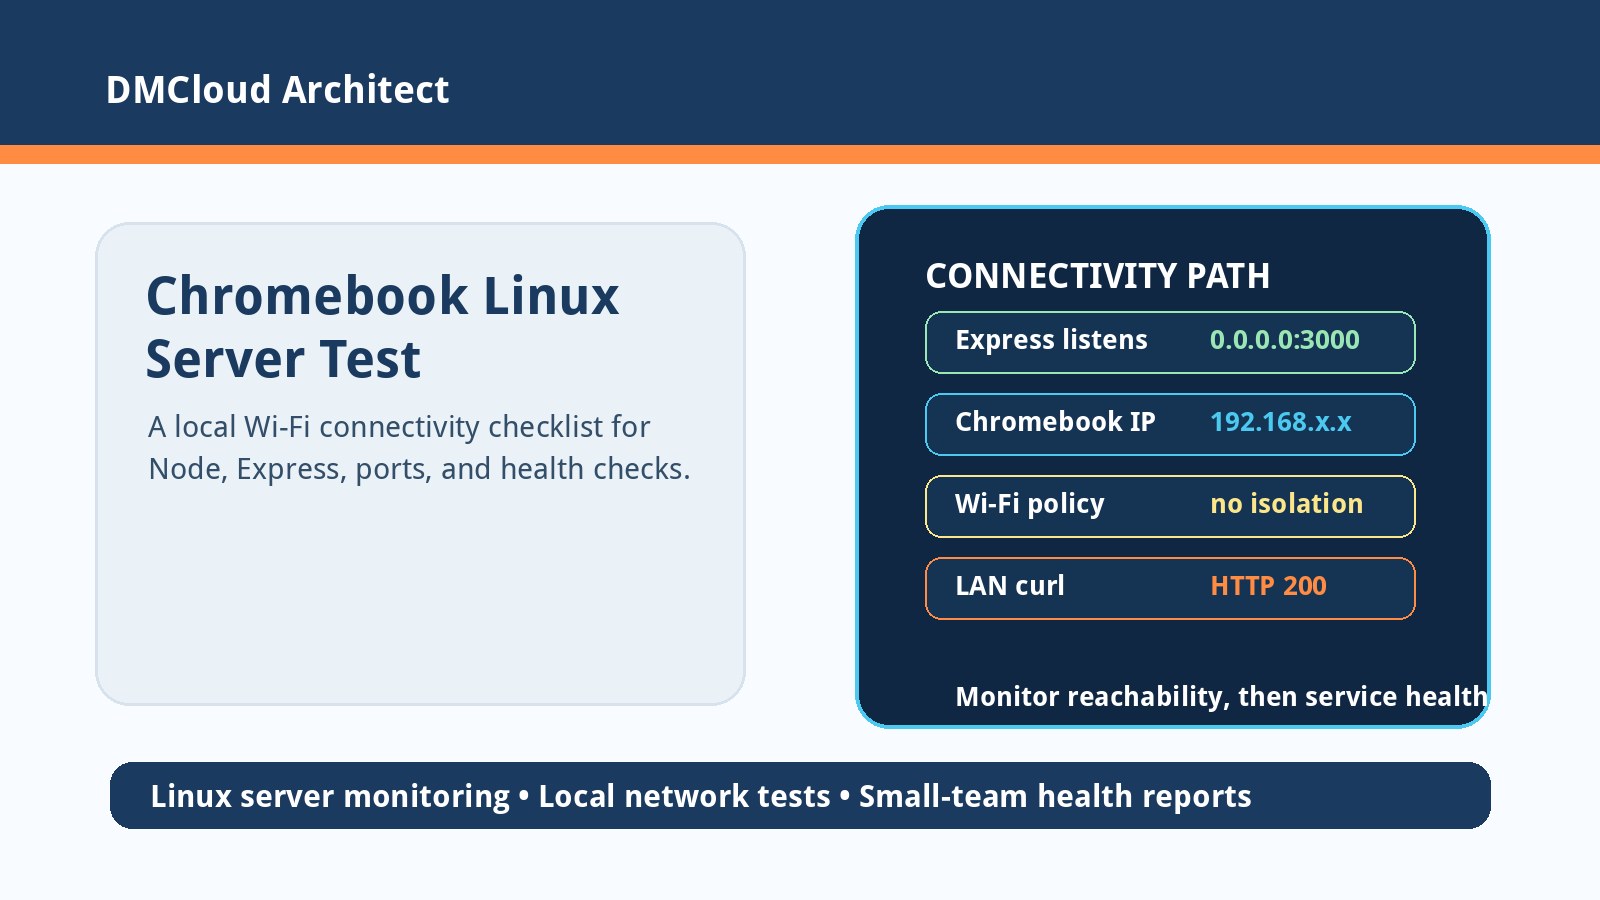
Start inside the Linux terminal and verify the Express app is bound to an address other devices can use. Many development examples listen on localhost or 127.0.0.1, which only accepts connections from the same environment. For a LAN test, bind the server to 0.0.0.0 and choose a known port such as 3000.

app.listen(3000, '0.0.0.0', () => {
  console.log('Listening on port 3000');
});

Then check the listener from the Linux side:

ss -ltnp | grep ':3000'
curl -I http://127.0.0.1:3000/

If the process is not listening, local network troubleshooting will only create noise. Make the local service boringly reliable first.

Check the address you are trying to reach

Private Wi-Fi addresses often look like 192.168.x.x, 10.x.x.x, or 172.16-31.x.x. On Chromebooks, there can be more than one relevant network layer: the ChromeOS host, the Linux container, and sometimes port-forwarding behavior between them. Use the ChromeOS network details and the Linux terminal to identify what address belongs to the Chromebook on the Wi-Fi network.

ip addr show
ip route
hostname -I

If the Linux container shows an internal address that other Wi-Fi devices cannot route to, try connecting to the Chromebook's Wi-Fi address rather than the container-only address. Also confirm that the client device is on the same network segment and not on a guest Wi-Fi network that blocks peer-to-peer traffic.

Use a three-step connectivity test

A simple checklist is better than guessing. Test each layer separately:

  • Device reachability: can another machine ping the Chromebook's Wi-Fi IP, if ICMP is allowed?
  • Port reachability: can another machine connect to the Express port with nc -vz 192.168.x.x 3000 or an equivalent tool?
  • Application response: can a browser or curl load http://192.168.x.x:3000/?

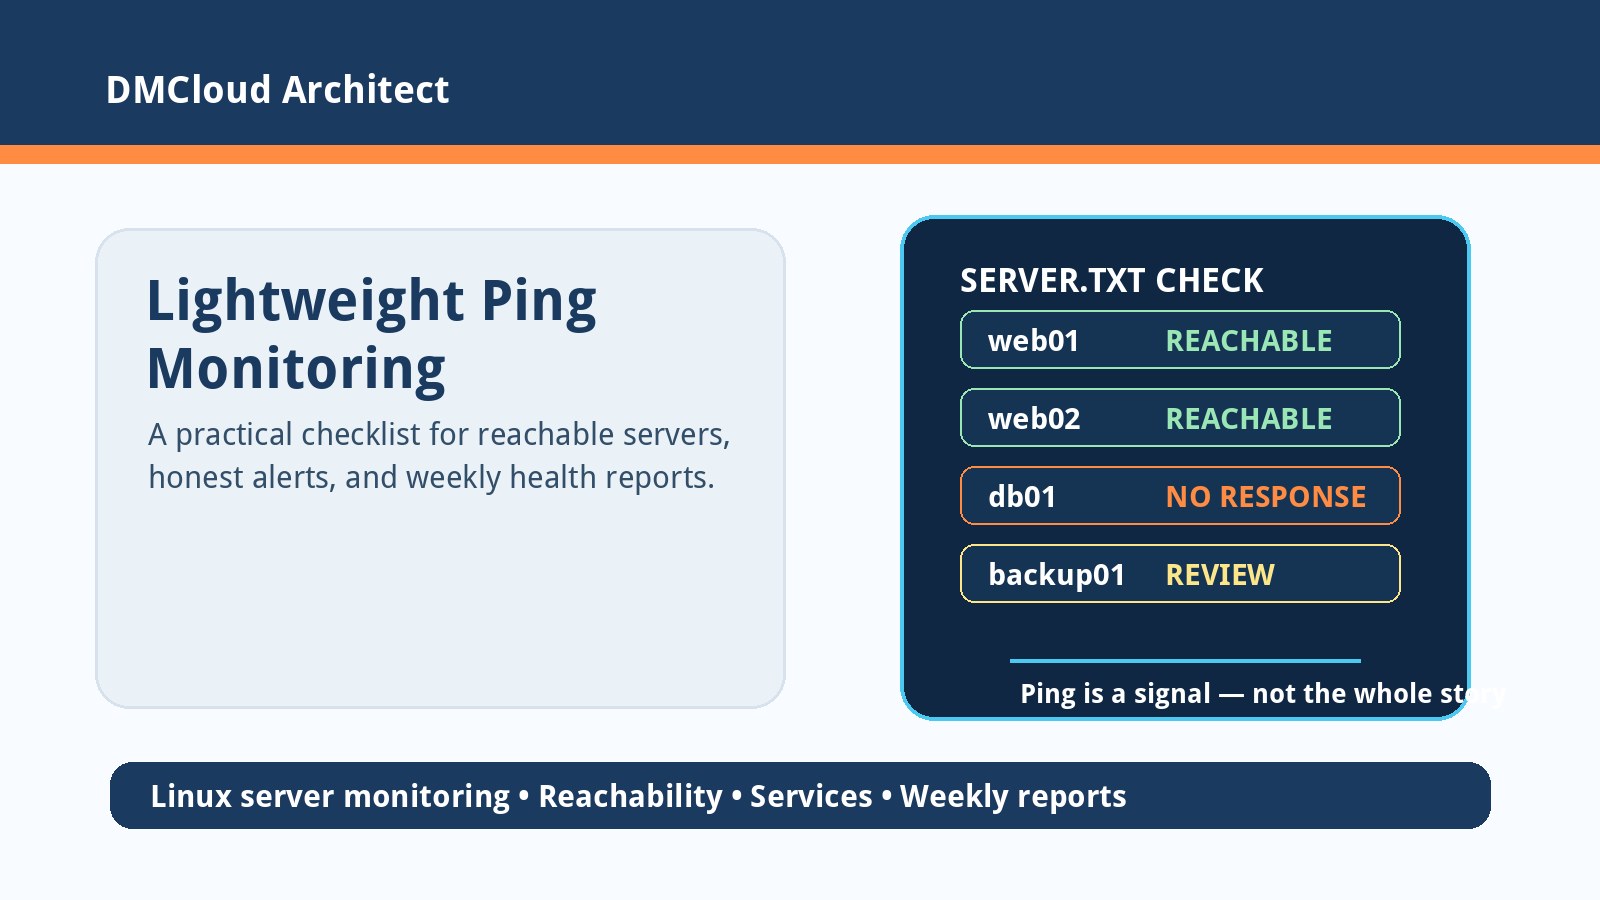
Keep the wording precise. A failed ping does not always mean the service is down, and a successful ping does not prove Express is reachable. Good linux server monitoring separates “host reachable,” “port open,” and “application healthy.”

Look for firewall, isolation, and Wi-Fi policy issues

Many home and office routers include client isolation, guest network isolation, or security settings that prevent one wireless device from reaching another. That is especially common on guest SSIDs, school networks, coworking spaces, hotels, and managed small-business Wi-Fi. If your phone and Chromebook can both browse the internet but cannot talk to each other, network isolation is a strong suspect.

Also check local firewall behavior. On a traditional Linux server, you might inspect ufw, firewalld, or cloud security groups. On ChromeOS, the path can be different because the Linux environment is containerized. If ChromeOS offers Linux port forwarding settings for your version and device, make sure the Express port is forwarded and enabled for the network test.

Use the right host for the job

A Chromebook can be a useful development box, but it is not always the best long-running server. Sleep behavior, changing Wi-Fi addresses, consumer router policies, and container networking can make it fragile for anything a client or team depends on. For a quick demo on the same desk, that may be fine. For a customer portal, reporting job, webhook receiver, or internal business tool, a small VPS or managed app platform is usually easier to monitor and secure.

If you do keep the service local, make it explicit: reserve the Chromebook's DHCP address if your router supports it, document the port, note which Wi-Fi network is allowed, and write down how to restart the app. Those small habits prevent tomorrow's troubleshooting from starting from zero.

A practical mini-monitoring checklist

Once the connection works, add a tiny health routine so you know when it stops working. You do not need a full observability stack for a short-lived prototype, but you do need repeatable signals.

  • Local process: confirm the Node process is running and listening on the expected port.
  • Local HTTP: run curl against 127.0.0.1 or localhost.
  • LAN HTTP: test the Chromebook's Wi-Fi address from a second device.
  • Address drift: note when the Wi-Fi IP changes after reboot or reconnect.
  • Power state: confirm sleep, lid, and battery settings will not interrupt the demo.
  • Logs: keep Express errors and restart events somewhere you can review.

When to turn troubleshooting into a health report

The first failed connection is usually a configuration problem. Repeated failures are an operations problem. If you are checking the same service every few days, wondering whether a port is still reachable, or explaining outages to non-technical stakeholders, it is time to turn ad hoc checks into a simple infrastructure health report.

For small teams, the useful report is not a wall of metrics. It should answer plain questions: what changed, what is reachable, what is slow, what is filling up, what failed recently, and what needs attention before users notice. That is where lightweight network checks, Linux service checks, logs, backups, and database health come together.

Want weekly infrastructure health checks without dashboard fatigue?

DMCloud Architect sends Linux and MySQL infrastructure health reports directly to your inbox, so you can spot risks early without adding another monitoring dashboard to watch.

Get the free starter plan for weekly infrastructure health reports.
About the Author
Mariusz Antonik

Oracle Cloud Infrastructure expert and consultant specializing in database management and automation.

All Tags
#Advanced #agent-visibility #alerts #amazon-linux-2023 #argo-cd #auditd #automation #backend-infrastructure #backup-verification #backups #bandwidth-monitoring #bare-metal-server #Bash #bash cpu monitoring script #bash monitoring #bash scripting #bash-automation #bash-scripts #Beginner #Best Practices #block volume backup #Capacity Planning #centos-ftp-migration #centralized-logging #chromebook-linux #cloud backup strategy #cloud-costs #cloud-database-setup #cloud-networking #cloudflare-workers #compute #container-monitoring #control-panel-security #cpu bottleneck #CPU Monitoring #cpu monitoring linux #cpu monitoring script linux #cpu trends #cpu usage trends #cpu usage trends linux #cpu-monitoring-script #cpu-monitoring-without-tools #cpu-performance-decline-server #cpu-performance-degradation-linux #cpu-usage-history-linux #create oracle db system in oci #cron #cron cpu monitoring #cron cpu monitoring linux #cron jobs #cron-monitoring #custom-linux-distribution #cve-advisory #database #database monitoring #database performance #database-health #database-setup #debian #detect slow queries mysql #devops #devops-checklist #devops-help #devops-learning #disk capacity planning server #disk forecasting linux #disk growth trend linux #Disk Monitoring #disk usage #disk usage script linux #disk usage trends #disk-capacity #disk-growth #disk-saturation-detection-linux #disk-usage-history-linux #Early Detection #easy infrastructure monitoring #egress-monitoring #elasticsearch #exposed-port-monitoring #fail2ban #field-server-checklist #firewall-rules #fleet-ops #free-tier #gitops-security #Guide #health dashboards #Health Reporting #historical server monitoring #historical-monitoring #home-lab #how to monitor cpu usage linux #https-certificates #infrastructure #infrastructure health #infrastructure health dashboard #infrastructure health reporting #infrastructure monitoring #infrastructure monitoring report #infrastructure trends #infrastructure trends monitoring #Infrastructure Visibility #infrastructure-automation #infrastructure-checklist #infrastructure-reporting #interview-prep #ip-allowlist #journald #kubernetes-security #lightweight linux monitoring #lightweight monitoring #lightweight-monitoring-solution #linux #linux administration #linux cpu monitoring #linux cpu usage #linux disk capacity planning #linux disk usage #Linux monitoring #linux monitoring setup #linux monitoring tools #linux performance #linux performance monitoring #linux server #linux server monitoring #linux servers #linux storage #linux tools #linux-admin #linux-disk-monitoring #linux-hardening #linux-hotspot #linux-monitoring-for-small-business #linux-networking #linux-performance-tuning #linux-remote-desktop #linux-security #linux-server-health #local-dns #local-network #log-management #log-retention #logrotate #loki #low maintenance monitoring #mkcert #monitor cpu usage over time linux #monitor linux server health #monitor server trends #monitor small production server #monitor-server-trends-over-time #monitoring #monitoring without complexity #monitoring-without-devops-team #MySQL #mysql health reporting #MySQL monitoring #mysql optimization #MySQL Performance #mysql performance degradation #mysql performance monitoring #mysql performance trends #mysql query performance issues #mysql server monitoring #mysql slow queries #mysql slow query analysis #mysql slow query monitoring #mysql trends #mysql-health #mysql-heatwave #mysql-monitoring-lightweight #mysql-workload-trends #networking #networkpolicy #node-express #nsg #OCI #oci backup #oci bastion tutorial #oci block volume #oci infrastructure as code #OCI monitoring #oci networking #oci oracle database private subnet setup #oci oracle database tutorial #oci security #oci setup guide #oci terraform tutorial #oci tutorial for beginners #oci vcn terraform #oci virtual machine db system guide #oci-database #oci-mysql-heatwave #oci-mysql-heatwave-tutorial #oci-subnets #offline-pwa #operations-checklist #oracle base database service tutorial #oracle cloud bastion #oracle cloud free tier tutorial #oracle cloud infrastructure step by step #oracle cloud infrastructure tutorial #oracle cloud storage #oracle database on oci setup #oracle-cloud #oracle-cloud-mysql-database-service #oracle-cloud-mysql-setup #oracle-cloud-vcn-setup #outbound-connections #patch-management #path-mtu-discovery #Performance #Performance Degradation #performance monitoring #performance trend monitoring #performance trends #ping-monitoring #plan disk growth server #plesk #practical server monitoring #predict disk usage growth #private instance access #process-monitoring #production-troubleshooting #proxmox #query optimization #query-trends #remote-workstation-security #rhel-tuned #rollback #route-tables #rsyslog #Security #security lists #security-monitoring #selinux #server #server health #server health reporting #server health weekly report #server monitoring #Server Performance #server trend analysis #server-audit #server-checklist #server-hardening #server-health-checklist #server-health-insights #server-security #server-security-audit #server-security-checklist #server-throughput #server-trends #server-troubleshooting #servers #service-worker #siem #simple cpu monitoring linux #simple linux monitoring #simple monitoring small business #simple monitoring system #simple ops monitoring #slow queries #slow query reporting mysql #small business infrastructure #small business IT #small business servers #small infrastructure monitoring #small server monitoring #small-business-security #small-business-tech #source-built-linux #ssh #ssh bastion #ssh-security #storage capacity planning linux #storage monitoring #subnets #sysadmin-checklist #sysadmin-lab #syscall-monitoring #System Health #system health reporting #systemd #tcp-mtu-probing #tcp-tuning #terraform oci compute #terraform oracle cloud infrastructure #track-disk-growth-linux #Trend Monitoring #trend-analysis #trends #tuned-adm #Tutorial #uptime-checks #uptime-monitoring #vcn #vcn-design #vector #vps-management #vsftpd #vulnerability-response #wazuh #weekly-server-report #windows-agent #xrdp