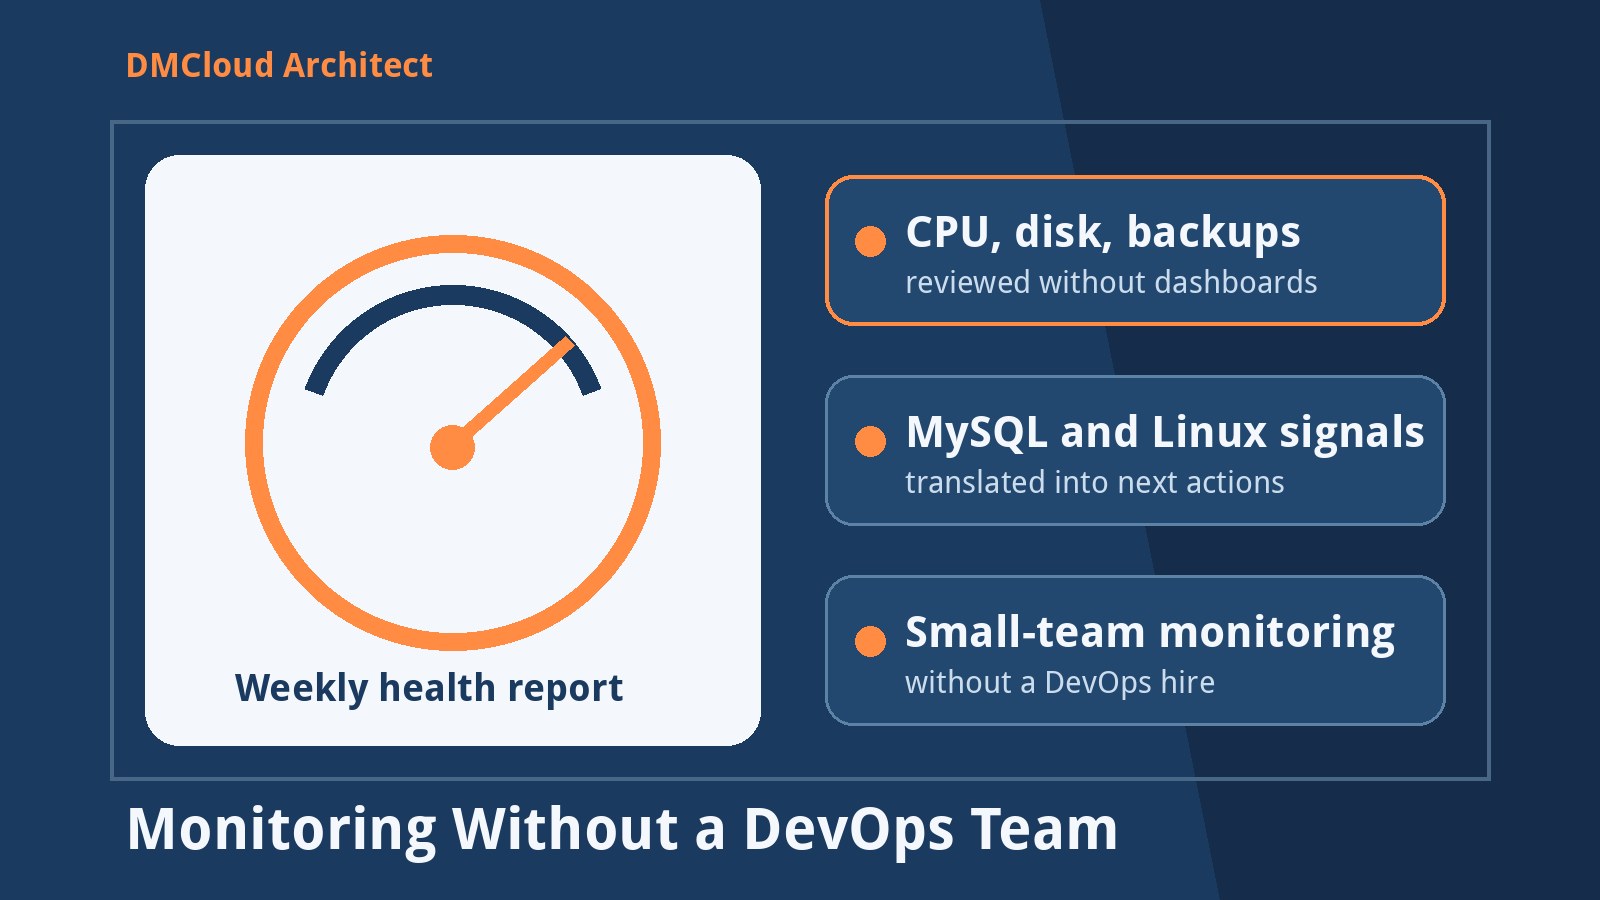
Many small businesses run important websites, internal tools, or customer portals on one or two production servers, but they do not have a dedicated DevOps team. That does not mean they can safely ignore monitoring. It means the monitoring system has to be smaller, clearer, and easier to act on.
A good monitoring without DevOps team approach focuses on the few signals that predict real service risk: server load, disk growth, memory pressure, MySQL health, backup freshness, certificate expiry, and obvious security or update drift. The goal is not to recreate an enterprise command center. The goal is to notice trouble early enough that a developer, business owner, or trusted support partner can schedule a fix before customers feel it.
Start with the risks that interrupt the business
Small teams often begin monitoring by installing a tool and turning on every default alert. That usually creates noise. A better starting point is to list the failures that would actually disrupt sales, support, or operations.
- Disk space: uploads fail, logs stop rotating, or MySQL cannot write temporary files.
- CPU and load: pages slow down during traffic spikes, reports, backups, or cron jobs.
- Memory pressure: the kernel starts swapping or services are killed unexpectedly.
- Database signals: slow queries, table growth, connection limits, and failed jobs quietly accumulate.
- Backups: the backup job appears configured but the latest usable backup is old or missing.
- Certificates and domains: a preventable expiry turns into an outage.
This risk-first list keeps monitoring grounded in business impact. If a signal does not help someone make a maintenance decision, it probably does not belong in the first version.
Choose a lightweight monitoring rhythm
Small infrastructure monitoring does not have to mean watching a dashboard all day. For many small production servers, a weekly review plus a few urgent checks is enough to catch slow-moving problems. Disk growth, certificate expiry, backup freshness, package updates, and MySQL table growth are trend problems; they become useful when reviewed regularly.
Use daily checks for issues that can become urgent quickly, such as disk thresholds or failed backups. Use weekly reporting for context: what changed, what is trending in the wrong direction, and what maintenance task should happen next. This turns monitoring into an operating habit rather than another screen to babysit.
Track a short list of Linux server health checks
For a simple monitoring small business setup, Linux health checks should be boring and repeatable. Start with commands and scripts that are easy to explain:
uptimeor load averages to spot sustained CPU pressure.df -handdf -ito catch disk and inode exhaustion.free -mand swap usage to detect memory pressure.- service status checks for the web server, database, queue workers, and scheduled jobs.
- log summaries for repeated errors instead of raw log dumps.
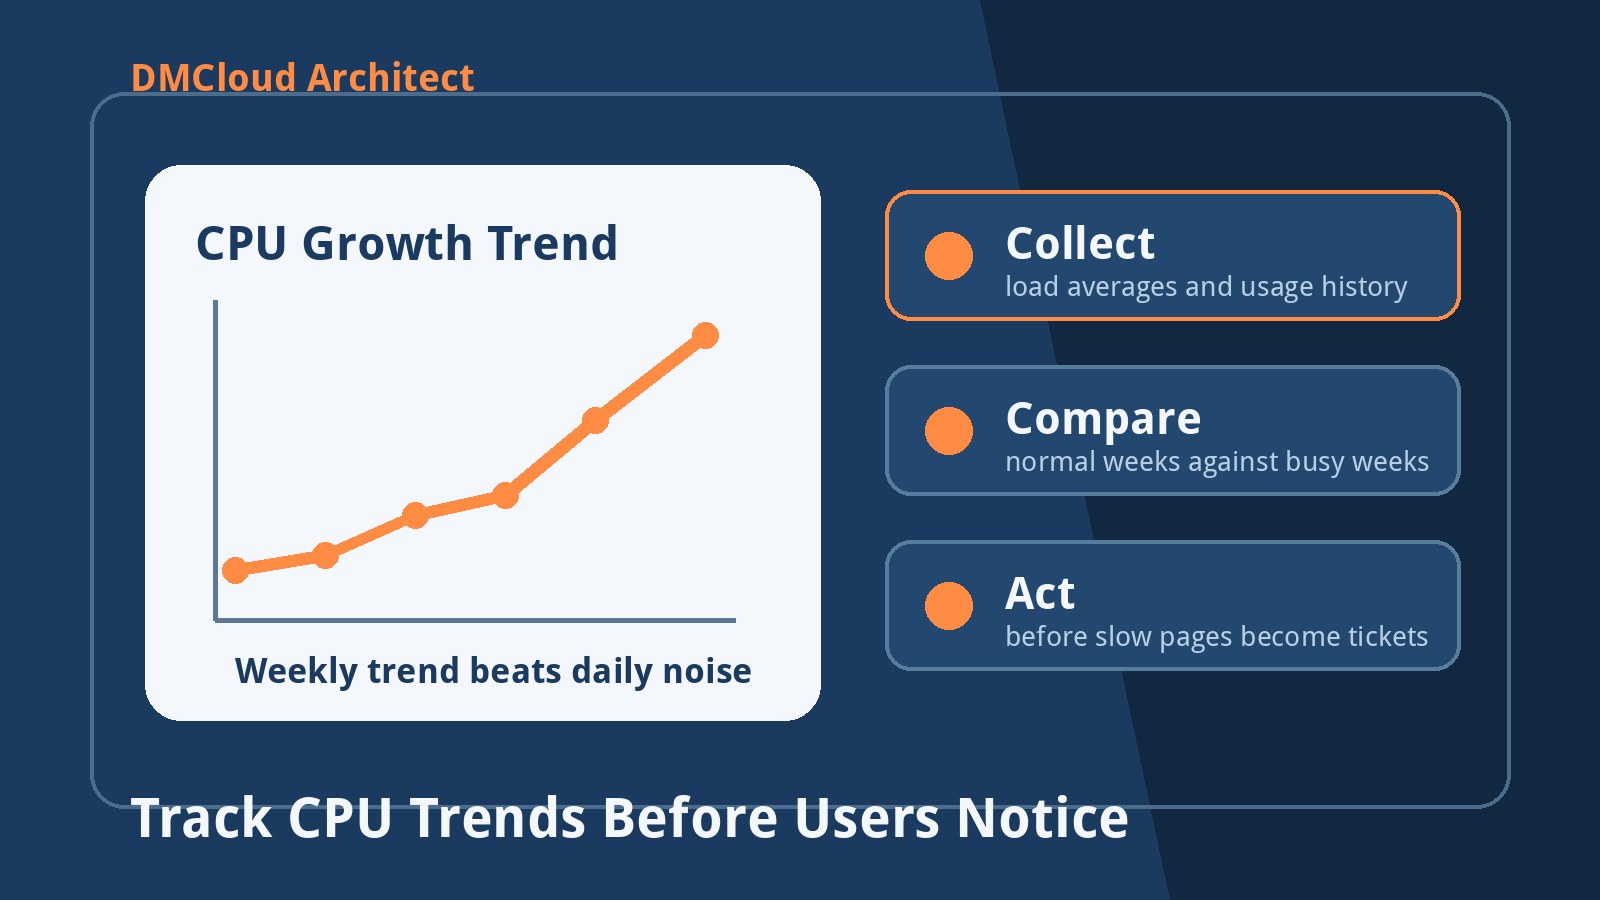
The important part is consistency. A single load number is less useful than knowing whether the server has been getting busier for the last four weeks. A single disk warning is less useful than knowing which directory is growing and whether it will hit a threshold before the next review.
Add MySQL checks that explain user-facing risk
For many small business applications, MySQL is where performance problems first become painful. Monitoring should include more than “is the database running?” It should answer whether the database is becoming slower, larger, or more fragile.
- Review slow query count and the worst repeated query patterns.
- Watch database and table size growth over time.
- Check failed backups and confirm the latest backup age.
- Look for connection saturation or repeated aborted connections.
- Confirm that binary logs, temporary files, and reports are not filling a disk.
This level of database monitoring is practical even without a DevOps hire. It gives a developer or owner a clear maintenance list: optimize this query, archive this table, adjust backup retention, resize this disk, or schedule a version update.
Use alerts sparingly
Alert fatigue is one reason small teams give up on monitoring. If every minor warning sends an email, people stop trusting the system. Reserve immediate alerts for conditions that need action soon: a failed public endpoint, a nearly full disk, a failed backup on a critical system, an expired certificate, or a database service that is down.
Everything else can usually go into a weekly infrastructure health report. That report should say what changed, why it matters, and what action is recommended. A useful report is more valuable than a noisy dashboard because it helps the business decide what to do next.
Document ownership before something breaks
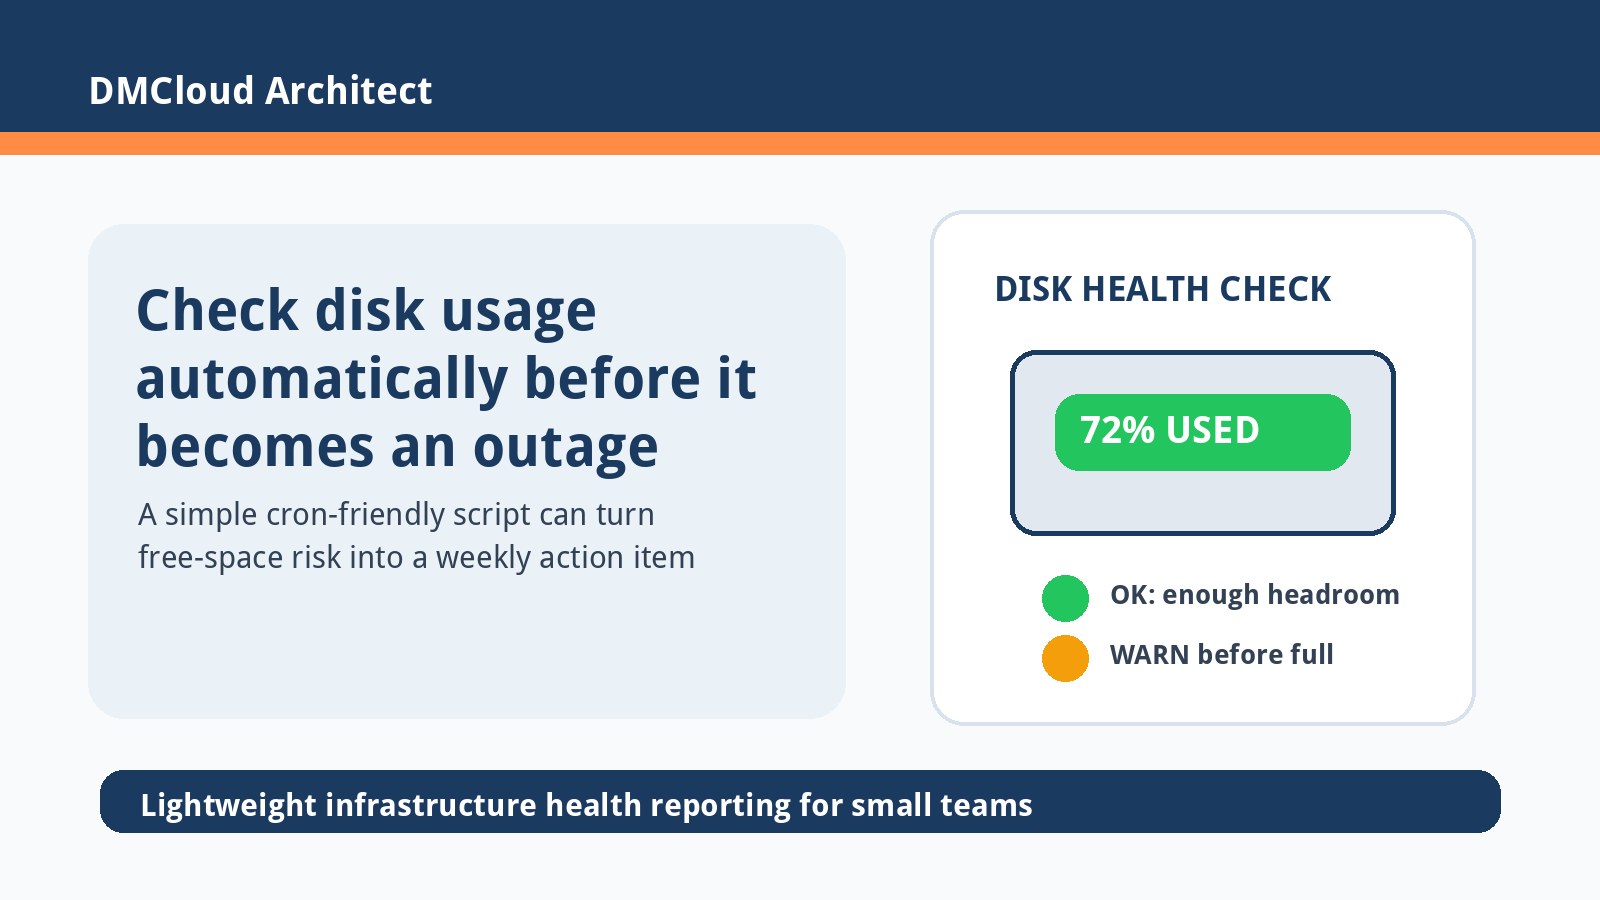
Monitoring is not complete until someone knows what happens after a warning. For each important check, write down who receives it, how quickly it should be reviewed, and what the first response should be. This can be simple: “If disk is above 85%, check backups and logs; if above 90%, contact support the same day.”
Clear ownership matters when there is no DevOps team. The monitoring process should reduce confusion, not create a new stream of technical messages that nobody feels responsible for.
A practical starter checklist
If you are monitoring one small production server, begin with this checklist:
- Daily disk threshold check for application, log, upload, and database volumes.
- Daily backup freshness check with a visible pass/fail result.
- Weekly load, memory, and service status review.
- Weekly MySQL slow query and table growth review.
- Monthly certificate, domain, package update, and security posture review.
- One written next action for every warning that remains open.
This is a lightweight monitoring solution, but it covers the areas that most often surprise lean teams. You can add more tooling later if the environment grows. The foundation is knowing what matters and reviewing it on schedule.
When a dashboard does make sense
Dashboards are useful when someone has time to look at them and when they answer a specific operational question. They are less useful when they become a guilt screen that nobody opens. If your team manages several servers, has traffic spikes, or needs fast incident response, dashboard-based monitoring may be worth the overhead.
Even then, keep the small-team discipline: monitor a short list of important signals, alert only on actionable issues, and summarize trends in plain language. Tools should support the maintenance process, not replace it.
Want small-server monitoring without dashboard overload?
DMCloud Architect provides weekly infrastructure health reports for Linux, MySQL, backups, certificates, and practical maintenance actions, built for developers and small business owners who do not have a dedicated DevOps team.
Get the free starter plan for weekly infrastructure health reports.