Back to Blog
Network Monitoring Dense View Checklist for Small Business Servers

Network Monitoring Dense View Checklist for Small Business Servers

   Mariusz Antonik    Automation    5 min read    6 views

A single dense terminal view can be useful when you are trying to understand a busy network quickly. Interface rates, latency checks, connection tables, and traffic shape all tell part of the story. The practical challenge for small teams is deciding which signals belong in everyday linux server monitoring, and which ones are only useful during a live troubleshooting session.

This checklist turns that idea into a small-business server health routine. It is not about staring at one more dashboard all day. It is about collecting the right network and system clues often enough that you spot risk early, explain incidents clearly, and avoid guessing when users report slowness.

Start with the questions a dense view should answer

A good monitoring view is not valuable because it is packed with numbers. It is valuable because it answers operational questions quickly. For a Linux server or small office network, the first questions are usually simple:

  • Is the server reachable? Confirm host availability before digging into application logs.
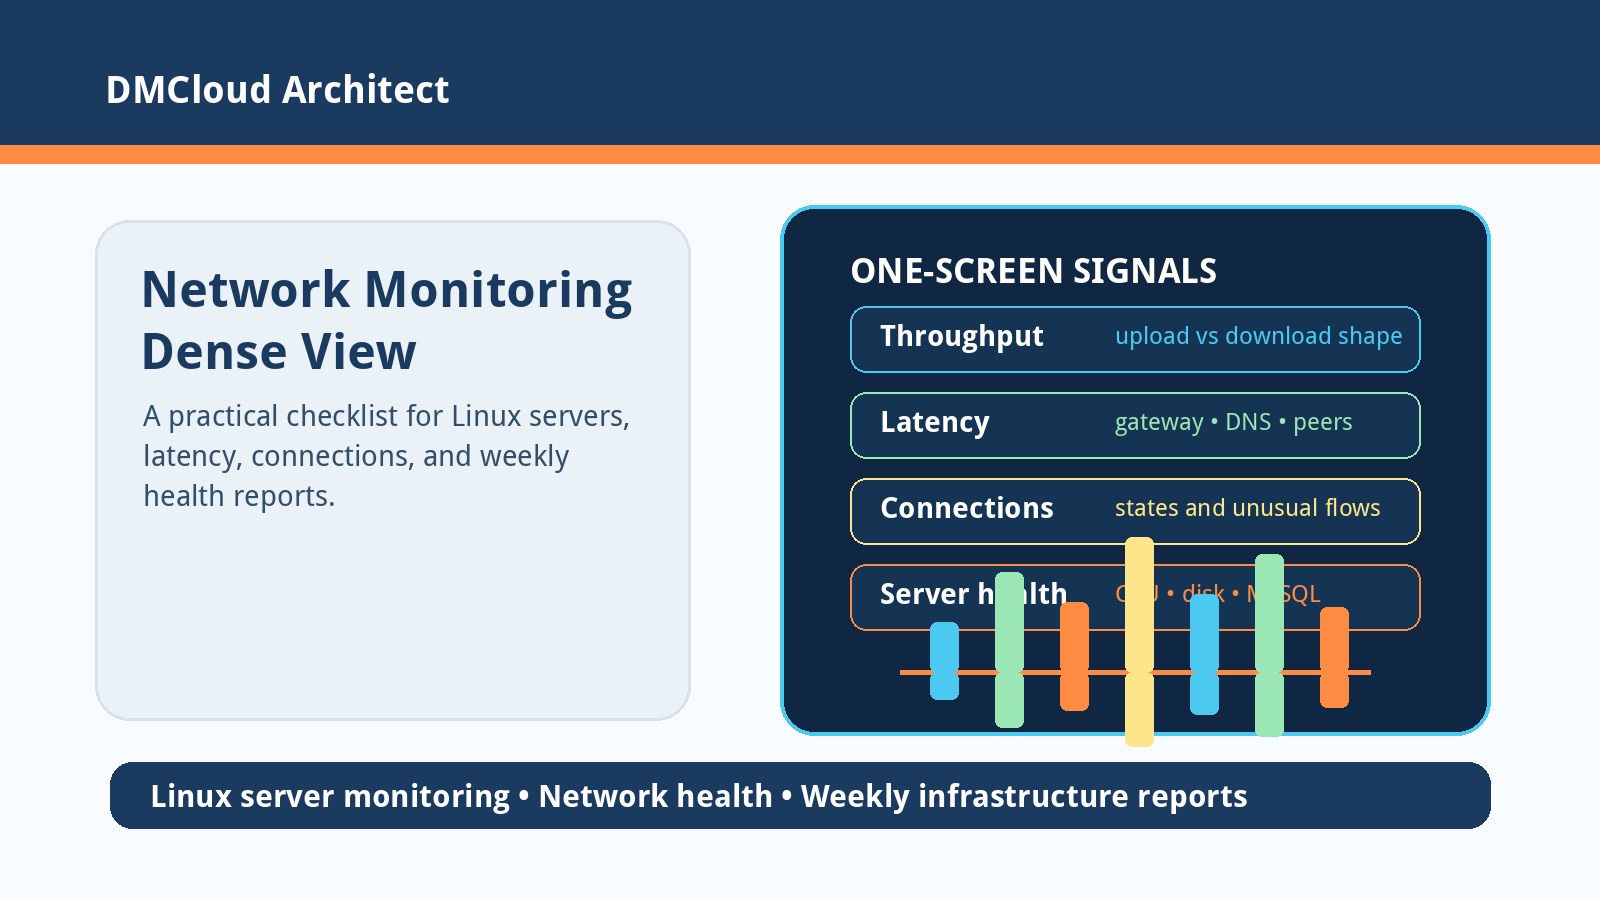
  • Is the network path healthy? Separate local gateway, DNS, internet, and upstream service latency.
  • Is throughput normal? Compare current upload and download traffic with the usual pattern for this server.
  • Are connections behaving normally? Look for unusual remote hosts, stuck states, or sudden growth in active sessions.
  • Is the bottleneck really the network? Check CPU, memory, disk I/O, and MySQL activity before blaming bandwidth.

If your weekly health report cannot answer these questions in plain language, it is probably collecting metrics rather than producing operational insight.

Track throughput shape, not just peak bandwidth

Peak bandwidth is easy to misunderstand. A short upload burst during backups or a package download may be harmless, while a smaller but constant stream can point to a sync job, export, retry loop, or unexpected outbound connection. For small teams, the useful signal is the shape of traffic over time.

Record upload and download separately. A web server with normal download-heavy traffic behaves differently from a reporting server that suddenly starts sending large amounts of data outward. If upload grows while application traffic is quiet, that deserves a closer look. If both directions rise together, you may be looking at normal user demand, a batch job, or a noisy integration.

Split latency into practical hops

One “ping is slow” number is rarely enough. Break latency into checkpoints that match how the service is used:

  • Gateway: tests local network health and router reachability.
  • DNS: catches lookup delays that can look like application slowness.
  • Internet: confirms the server can reach a stable outside target.
  • Important peers: checks database hosts, APIs, backup targets, or payment gateways.

This keeps troubleshooting grounded. If the gateway is fast but DNS is slow, the fix is different from a saturated WAN link. If internet latency is fine but a database peer is slow, the application path needs attention.

Review connection state without turning it into noise

Connection tables can reveal useful patterns: many short-lived retries, long-running connections from unexpected addresses, too many sessions in wait states, or one internal service overwhelming another. On Linux, tools such as ss, ip, nload, iftop, and modern terminal monitors can help during live investigation.

For routine linux server monitoring, avoid dumping every connection into a report. Summarize what changed: top remote networks, unusual destination ports, connection counts by state, and whether any new outbound pattern appeared. A business owner does not need every socket; they need to know whether the server is behaving differently than last week.

Compare network signals with server health

Network symptoms often start somewhere else. A slow MySQL query can make a web request look like a network problem. A full disk can delay logs, sessions, queues, or backups. High CPU steal time on a VPS can make every service feel unreliable even when the network path is fine.

Build a compact cross-check:

  • CPU: load average, steal time, and sustained saturation.
  • Memory: swap use, OOM events, and growth trends.
  • Disk: free space, inode pressure, I/O wait, and backup growth.
  • Database: slow queries, connection count, table growth, and failed jobs.
  • Network: throughput, error counters, latency checkpoints, and connection-state changes.

The goal is not to prove every metric is perfect. The goal is to catch the small drift that becomes a Monday morning outage.

Create a weekly dense summary for people, not dashboards

A dense terminal screen is helpful during an incident because it puts many clues in one place. A weekly health report should do the same thing in a calmer format. Keep the report short, consistent, and action-oriented:

  • What changed? Highlight meaningful differences from the prior week.
  • What is at risk? Call out disk growth, repeated latency spikes, failed backups, or abnormal traffic.
  • What should be done next? Give one or two practical actions, not a pile of raw charts.
  • What can wait? Reduce alert fatigue by separating watch items from urgent issues.

This is where small-business monitoring often improves: fewer alarms, better context, and enough history to see trends before they become emergencies.

Use live tools for incidents and reports for prevention

Terminal monitoring tools are excellent when an engineer is actively investigating. They show the live shape of traffic, the current connection table, and the immediate latency path. But they only help if someone is watching at the right moment.

For prevention, turn the same thinking into scheduled checks. Capture the important signals, compare them with last week, and send a readable report to the person responsible for the system. That gives developers and small business owners a practical way to stay aware without living inside a dashboard.

Want weekly infrastructure health checks without dashboard fatigue?

DMCloud Architect sends Linux and MySQL infrastructure health reports directly to your inbox, so you can spot network, disk, CPU, and database risks before they become user-facing incidents.

Get the free starter plan for weekly infrastructure health reports.
About the Author
Mariusz Antonik

Oracle Cloud Infrastructure expert and consultant specializing in database management and automation.

All Tags
#Advanced #agent-visibility #alerts #amazon-linux-2023 #argo-cd #auditd #automation #backend-infrastructure #backup-verification #backups #bandwidth-monitoring #bare-metal-server #Bash #bash cpu monitoring script #bash monitoring #bash scripting #bash-automation #bash-scripts #Beginner #Best Practices #block volume backup #Capacity Planning #centos-ftp-migration #centralized-logging #chromebook-linux #cloud backup strategy #cloud-costs #cloud-database-setup #cloud-networking #cloudflare-workers #compute #container-monitoring #control-panel-security #cpu bottleneck #CPU Monitoring #cpu monitoring linux #cpu monitoring script linux #cpu trends #cpu usage trends #cpu usage trends linux #cpu-monitoring-script #cpu-monitoring-without-tools #cpu-performance-decline-server #cpu-performance-degradation-linux #cpu-usage-history-linux #create oracle db system in oci #cron #cron cpu monitoring #cron cpu monitoring linux #cron jobs #cron-monitoring #custom-linux-distribution #cve-advisory #database #database monitoring #database performance #database-health #database-setup #debian #detect slow queries mysql #devops #devops-checklist #devops-help #devops-learning #disk capacity planning server #disk forecasting linux #disk growth trend linux #Disk Monitoring #disk usage #disk usage script linux #disk usage trends #disk-capacity #disk-growth #disk-saturation-detection-linux #disk-usage-history-linux #Early Detection #easy infrastructure monitoring #egress-monitoring #elasticsearch #exposed-port-monitoring #fail2ban #field-server-checklist #firewall-rules #fleet-ops #free-tier #gitops-security #Guide #health dashboards #Health Reporting #historical server monitoring #historical-monitoring #home-lab #how to monitor cpu usage linux #https-certificates #infrastructure #infrastructure health #infrastructure health dashboard #infrastructure health reporting #infrastructure monitoring #infrastructure monitoring report #infrastructure trends #infrastructure trends monitoring #Infrastructure Visibility #infrastructure-automation #infrastructure-checklist #infrastructure-reporting #interview-prep #ip-allowlist #journald #kubernetes-security #latency-checks #lightweight linux monitoring #lightweight monitoring #lightweight-monitoring-solution #linux #linux administration #linux cpu monitoring #linux cpu usage #linux disk capacity planning #linux disk usage #Linux monitoring #linux monitoring setup #linux monitoring tools #linux performance #linux performance monitoring #linux server #linux server monitoring #linux servers #linux storage #linux tools #linux-admin #linux-disk-monitoring #linux-hardening #linux-hotspot #linux-monitoring-for-small-business #linux-networking #linux-performance-tuning #linux-remote-desktop #linux-security #linux-server-health #local-dns #local-network #log-management #log-retention #logrotate #loki #low maintenance monitoring #mkcert #monitor cpu usage over time linux #monitor linux server health #monitor server trends #monitor small production server #monitor-server-trends-over-time #monitoring #monitoring without complexity #monitoring-without-devops-team #MySQL #mysql health reporting #MySQL monitoring #mysql optimization #MySQL Performance #mysql performance degradation #mysql performance monitoring #mysql performance trends #mysql query performance issues #mysql server monitoring #mysql slow queries #mysql slow query analysis #mysql slow query monitoring #mysql trends #mysql-health #mysql-heatwave #mysql-monitoring-lightweight #mysql-workload-trends #network-monitoring #networking #networkpolicy #node-express #nsg #OCI #oci backup #oci bastion tutorial #oci block volume #oci infrastructure as code #OCI monitoring #oci networking #oci oracle database private subnet setup #oci oracle database tutorial #oci security #oci setup guide #oci terraform tutorial #oci tutorial for beginners #oci vcn terraform #oci virtual machine db system guide #oci-database #oci-mysql-heatwave #oci-mysql-heatwave-tutorial #oci-subnets #offline-pwa #operations-checklist #oracle base database service tutorial #oracle cloud bastion #oracle cloud free tier tutorial #oracle cloud infrastructure step by step #oracle cloud infrastructure tutorial #oracle cloud storage #oracle database on oci setup #oracle-cloud #oracle-cloud-mysql-database-service #oracle-cloud-mysql-setup #oracle-cloud-vcn-setup #outbound-connections #patch-management #path-mtu-discovery #Performance #Performance Degradation #performance monitoring #performance trend monitoring #performance trends #ping-monitoring #plan disk growth server #plesk #practical server monitoring #predict disk usage growth #private instance access #process-monitoring #production-troubleshooting #proxmox #query optimization #query-trends #remote-workstation-security #rhel-tuned #rollback #route-tables #rsyslog #Security #security lists #security-monitoring #selinux #server #server health #server health reporting #server health weekly report #server monitoring #Server Performance #server trend analysis #server-audit #server-checklist #server-hardening #server-health-checklist #server-health-insights #server-security #server-security-audit #server-security-checklist #server-throughput #server-trends #server-troubleshooting #servers #service-worker #siem #simple cpu monitoring linux #simple linux monitoring #simple monitoring small business #simple monitoring system #simple ops monitoring #slow queries #slow query reporting mysql #small business infrastructure #small business IT #small business servers #small infrastructure monitoring #small server monitoring #small-business-monitoring #small-business-security #small-business-tech #source-built-linux #ssh #ssh bastion #ssh-security #storage capacity planning linux #storage monitoring #subnets #sysadmin-checklist #sysadmin-lab #syscall-monitoring #System Health #system health reporting #systemd #tcp-mtu-probing #tcp-tuning #terraform oci compute #terraform oracle cloud infrastructure #track-disk-growth-linux #Trend Monitoring #trend-analysis #trends #tuned-adm #Tutorial #uptime-checks #uptime-monitoring #vcn #vcn-design #vector #vps-management #vsftpd #vulnerability-response #wazuh #weekly-server-report #windows-agent #xrdp