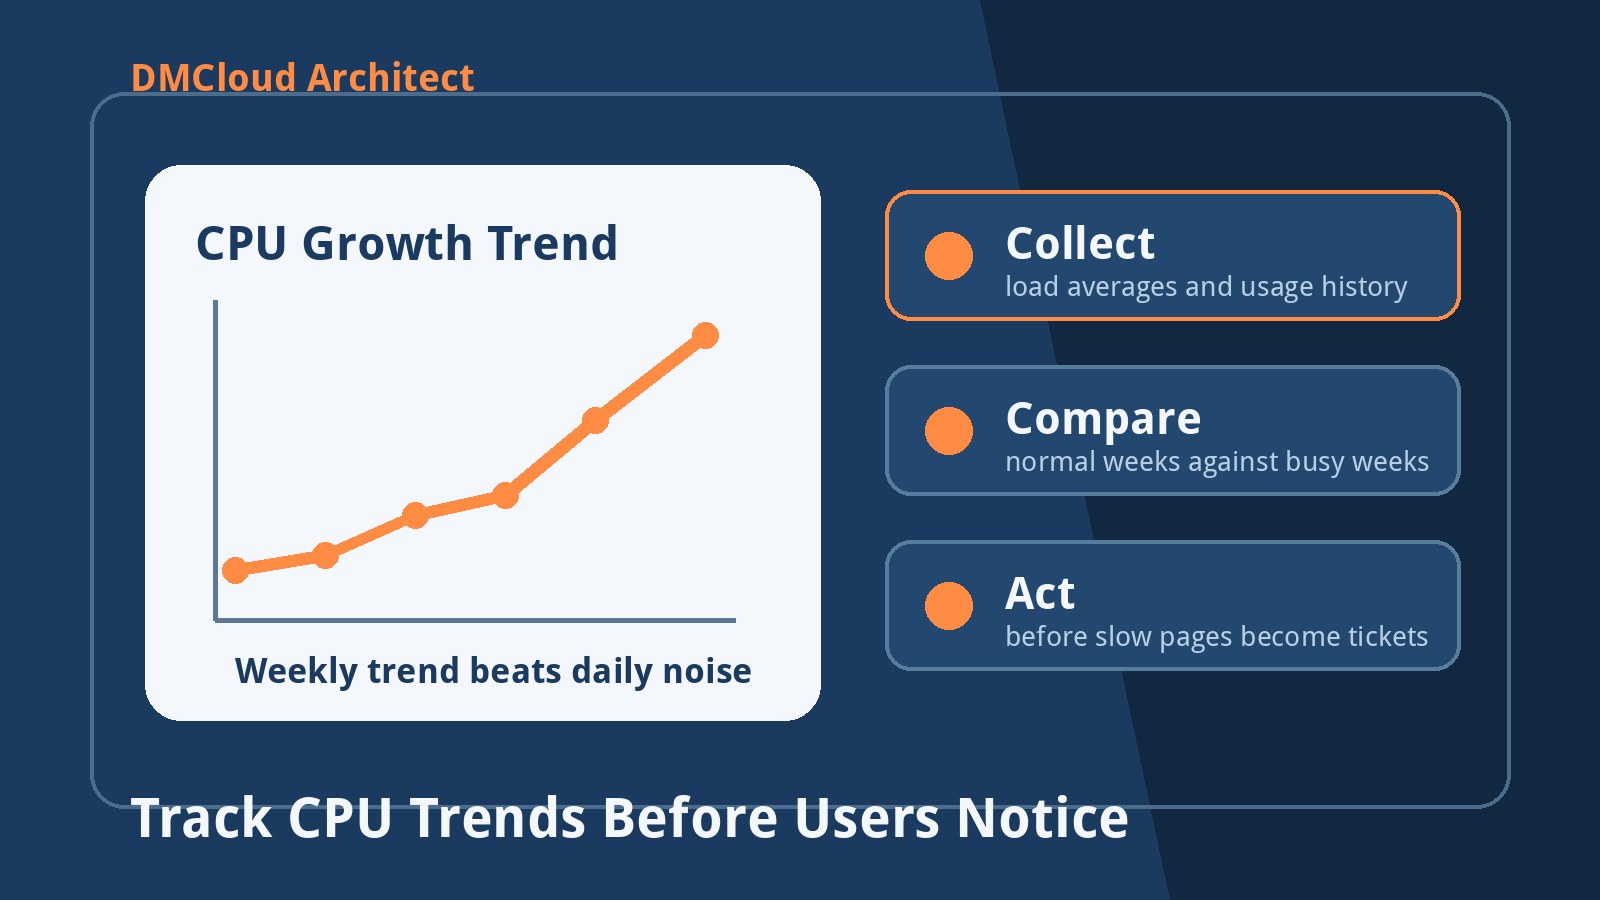
CPU problems rarely begin as a dramatic outage. More often, a server feels fine for months, then pages start taking longer to render, reports slow down, backups overlap with business hours, or MySQL queries begin competing with application traffic. By the time users complain, the CPU trend has usually been visible for weeks.
That is why a practical cpu growth trend server review matters. The goal is not to obsess over every short spike. The goal is to see whether normal workload is drifting upward and whether the server still has enough headroom for real business use.
Why CPU trend monitoring beats one-off snapshots
A single CPU reading only answers what happened at that moment. It does not explain whether today is normal, whether the server is busier than last month, or whether a new job changed the workload pattern. Trend monitoring adds the missing context.
For small teams, the useful question is simple: is the server working harder during the same type of day than it used to? If the answer is yes for several weeks, you can investigate during calm maintenance time instead of reacting during a slow customer session.
Collect the right Linux CPU signals
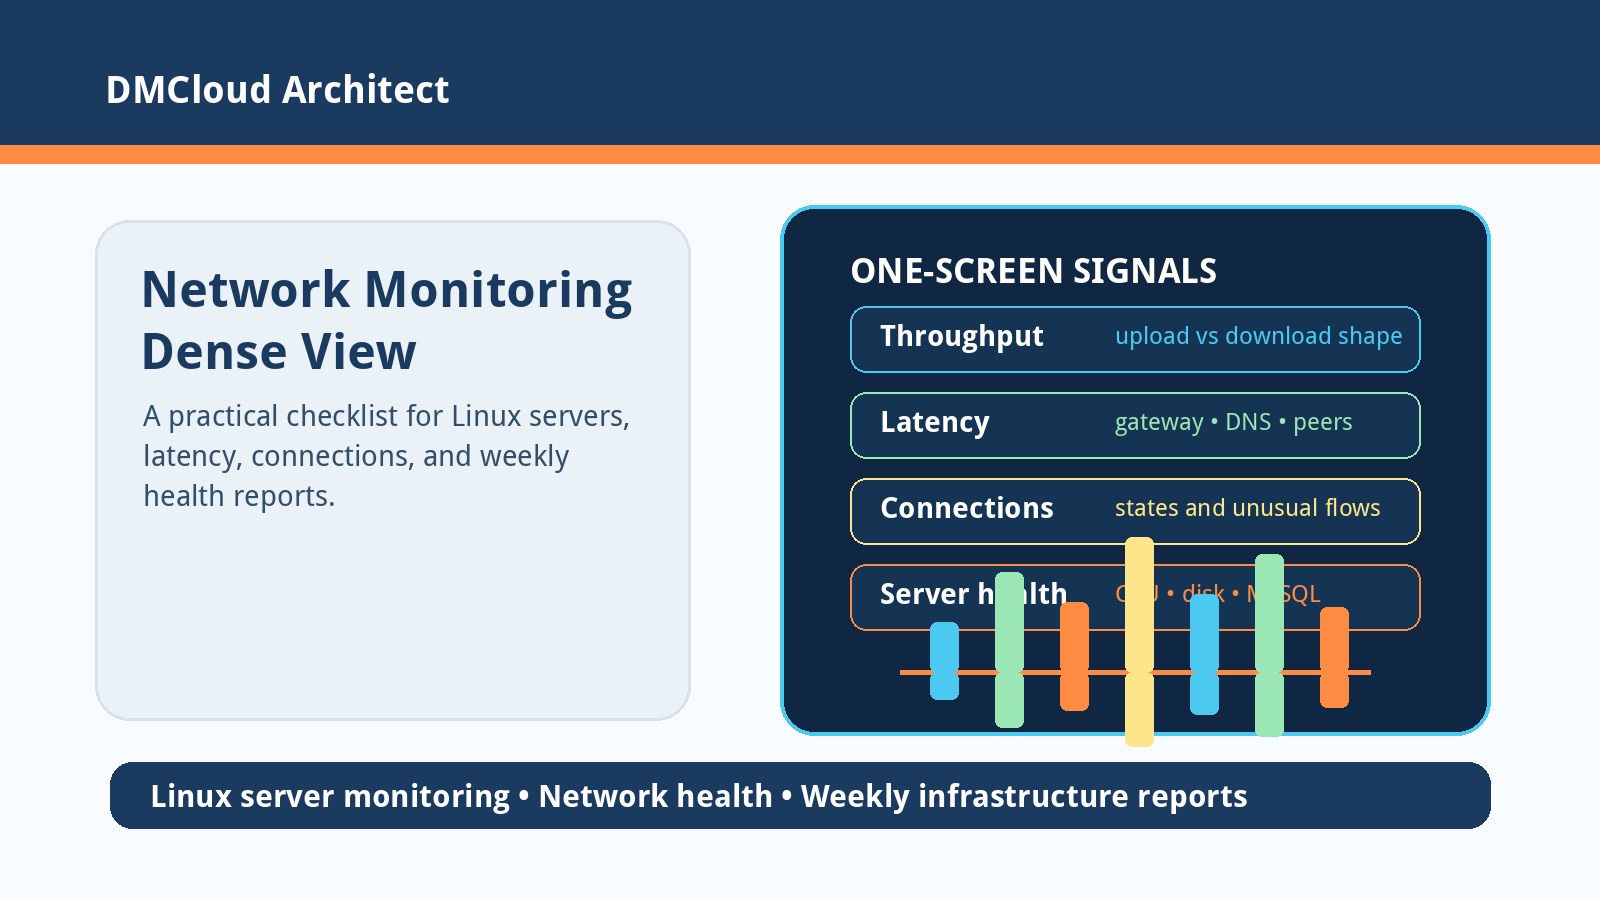
Linux gives you enough information to build a useful baseline without buying a complex monitoring stack. Start with repeatable signals that are easy to explain and compare:
- Load averages: review the 1, 5, and 15 minute values from
uptimeor/proc/loadavg. - CPU utilization: track user, system, idle, and steal time if the server runs on a virtual machine.
- Run queue pressure: sustained load above available CPU cores can point to contention.
- Process-level usage: record which services are regularly at the top, not only which service spiked once.
- Time of day: connect CPU pressure to cron jobs, backups, imports, reports, and traffic periods.
This does not need to be complicated. Even a small script that records hourly CPU and load values can create enough history to see whether the server is becoming busier over time.
Separate harmless spikes from capacity risk
Short CPU spikes are normal. A backup compresses files, a report runs, a search index rebuilds, or a burst of visitors lands at once. Those events are worth noting, but they are not automatically a capacity problem.
Sustained growth is different. If the 15 minute load average is higher every week, if idle time is shrinking during normal business hours, or if the same process keeps consuming more CPU, the server may be losing headroom. That is the point where trend data becomes a maintenance signal.
Use weekly comparisons instead of dashboard watching
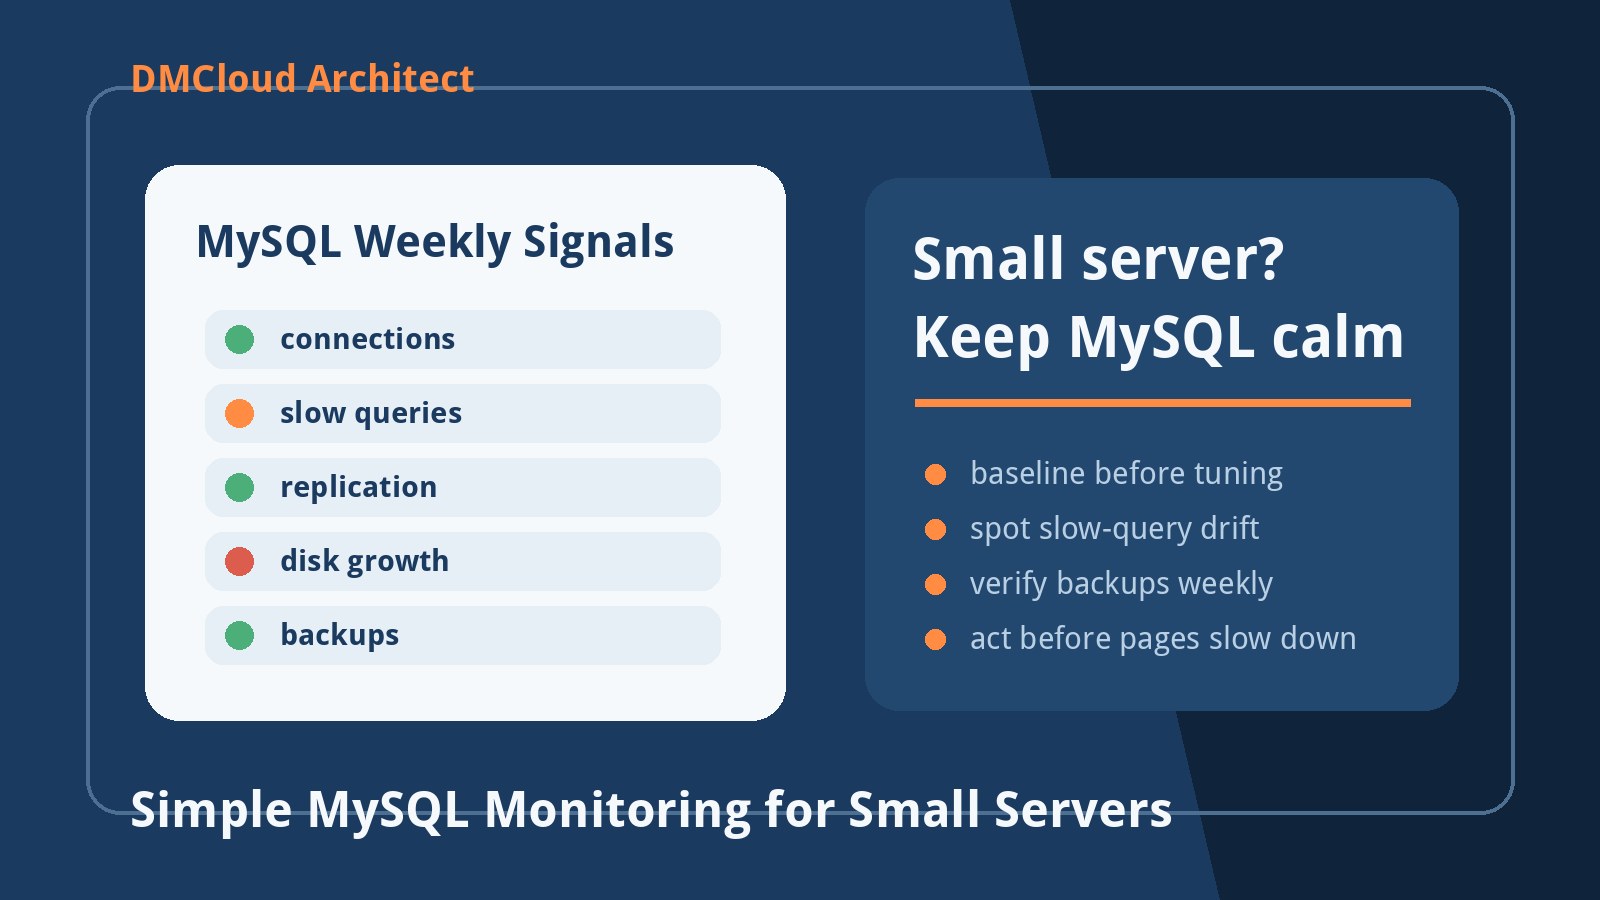
Many small businesses do not have someone available to watch a dashboard all day. A weekly infrastructure health review is often more realistic. The report should compare the latest CPU pattern with previous weeks and call out what changed.
- Was average CPU higher than the previous four-week baseline?
- Did peak CPU happen at a predictable time?
- Did load stay elevated after a cron job or backup completed?
- Did MySQL, PHP, Java, Node.js, or a queue worker become the repeated top consumer?
- Is the trend moving toward a resize, query review, cache change, or job schedule adjustment?
This style of cpu usage trends linux review turns raw numbers into a short list of actions. It is more useful than a chart that nobody opens until something is already slow.
Connect CPU growth to user-facing symptoms
CPU data should not live in isolation. When a server's CPU trend rises, compare it with symptoms that users or business owners actually notice: slower page loads, longer checkout steps, delayed admin reports, failed background jobs, or database timeouts.
For example, if CPU growth lines up with larger MySQL tables and slower queries, buying a bigger server may only hide the real issue for a while. If CPU pressure appears during backups, changing the backup schedule or compression settings may solve the problem without infrastructure changes. If traffic has genuinely grown, a resize or caching layer may be the right next step.
Watch for virtual server steal time
On cloud or VPS hosts, CPU usage is not the only signal. Steal time shows when the virtual machine wanted CPU but the host did not provide it immediately. If steal time rises, the application may feel slow even when your own processes look reasonable.
For developers and small business owners, this is an important distinction. A slow server is not always caused by your code. Weekly reporting should flag repeated steal time so you can decide whether to move plans, change instance size, or raise the issue with the hosting provider.
Turn the trend into maintenance decisions
The best monitoring output is a decision, not just a number. A CPU trend report should end with one of a few practical recommendations:
- No action: usage is stable and headroom remains healthy.
- Investigate: a specific process, query, cron job, or traffic period needs review.
- Schedule maintenance: adjust job timing, tune a query, update caching, or archive old data.
- Plan capacity: resize the server or separate services before the next busy period.
This keeps monitoring friendly for lean teams. You do not need a full-time DevOps role to benefit from cpu trend monitoring linux. You need consistent measurements, a plain-language summary, and a clear next action.
A starter checklist for CPU trend reviews
If you want to begin this week, keep the first version small:
- Record hourly load average and CPU utilization.
- Keep at least four weeks of history before calling a pattern normal.
- Tag known jobs such as backups, imports, reports, and maintenance scripts.
- Review top CPU-consuming services during peak periods.
- Compare CPU trend with slow queries, web response time, and failed jobs.
- Write one recommended next action when the trend changes.
That small habit can catch the warning signs that are easy to miss in day-to-day development work. It also gives the business a calmer way to plan fixes before users notice performance problems.
Want CPU trend monitoring without dashboard overload?
DMCloud Architect provides weekly infrastructure health reports for Linux, MySQL, backups, certificates, and practical maintenance actions, built for developers and small business owners who want early warning without alert fatigue.
Get the free starter plan for weekly infrastructure health reports.